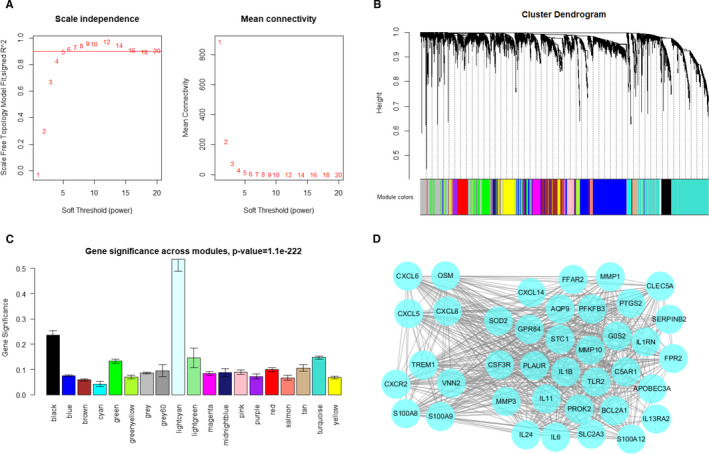
FIGURE 3.

Identifying hub genes associated with neutrophil infiltration in GSE39582 data set. A, Analysis of the scale‐free fit index and the mean connectivity for various soft‐thresholding powers. B, Dendrogram of all differentially expressed genes clustered based on a dissimilarity measure. Dynamic tree cutting was applied to identify modules by dividing the dendrogram at significant branch points. Modules are displayed with different colours in the horizontal bar immediately below the dendrogram. C, Distribution of average gene significance in the modules based on neutrophil score derived from CIBERSORTx. D, Visualization of gene network in lightcyan module
