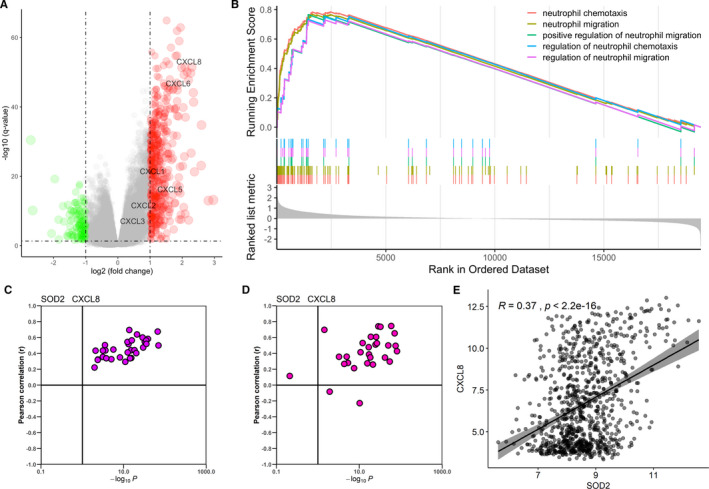
FIGURE 6.

Functional exploration of SOD2. A, Volcano plot of Differentially expressed genes (DEGs) of high/low SOD2 group in TCGA COARD cohort. B,GSEA analysis, genes are ordered by logFC value derived from DEGs calculation. C, Correlation of SOD2 and CXCL8 in 32 types of cancer from TCGA data. Vertical line corresponding with a p‐value of 0.1. D, Correlation of SOD2 and CXCL8 in 30 types of tissue from GTEx data. Vertical line corresponding with a p‐value of 0.1. E, Correlation of SOD2 and CXCL8 in 917 cancer cell lines from CCLE
