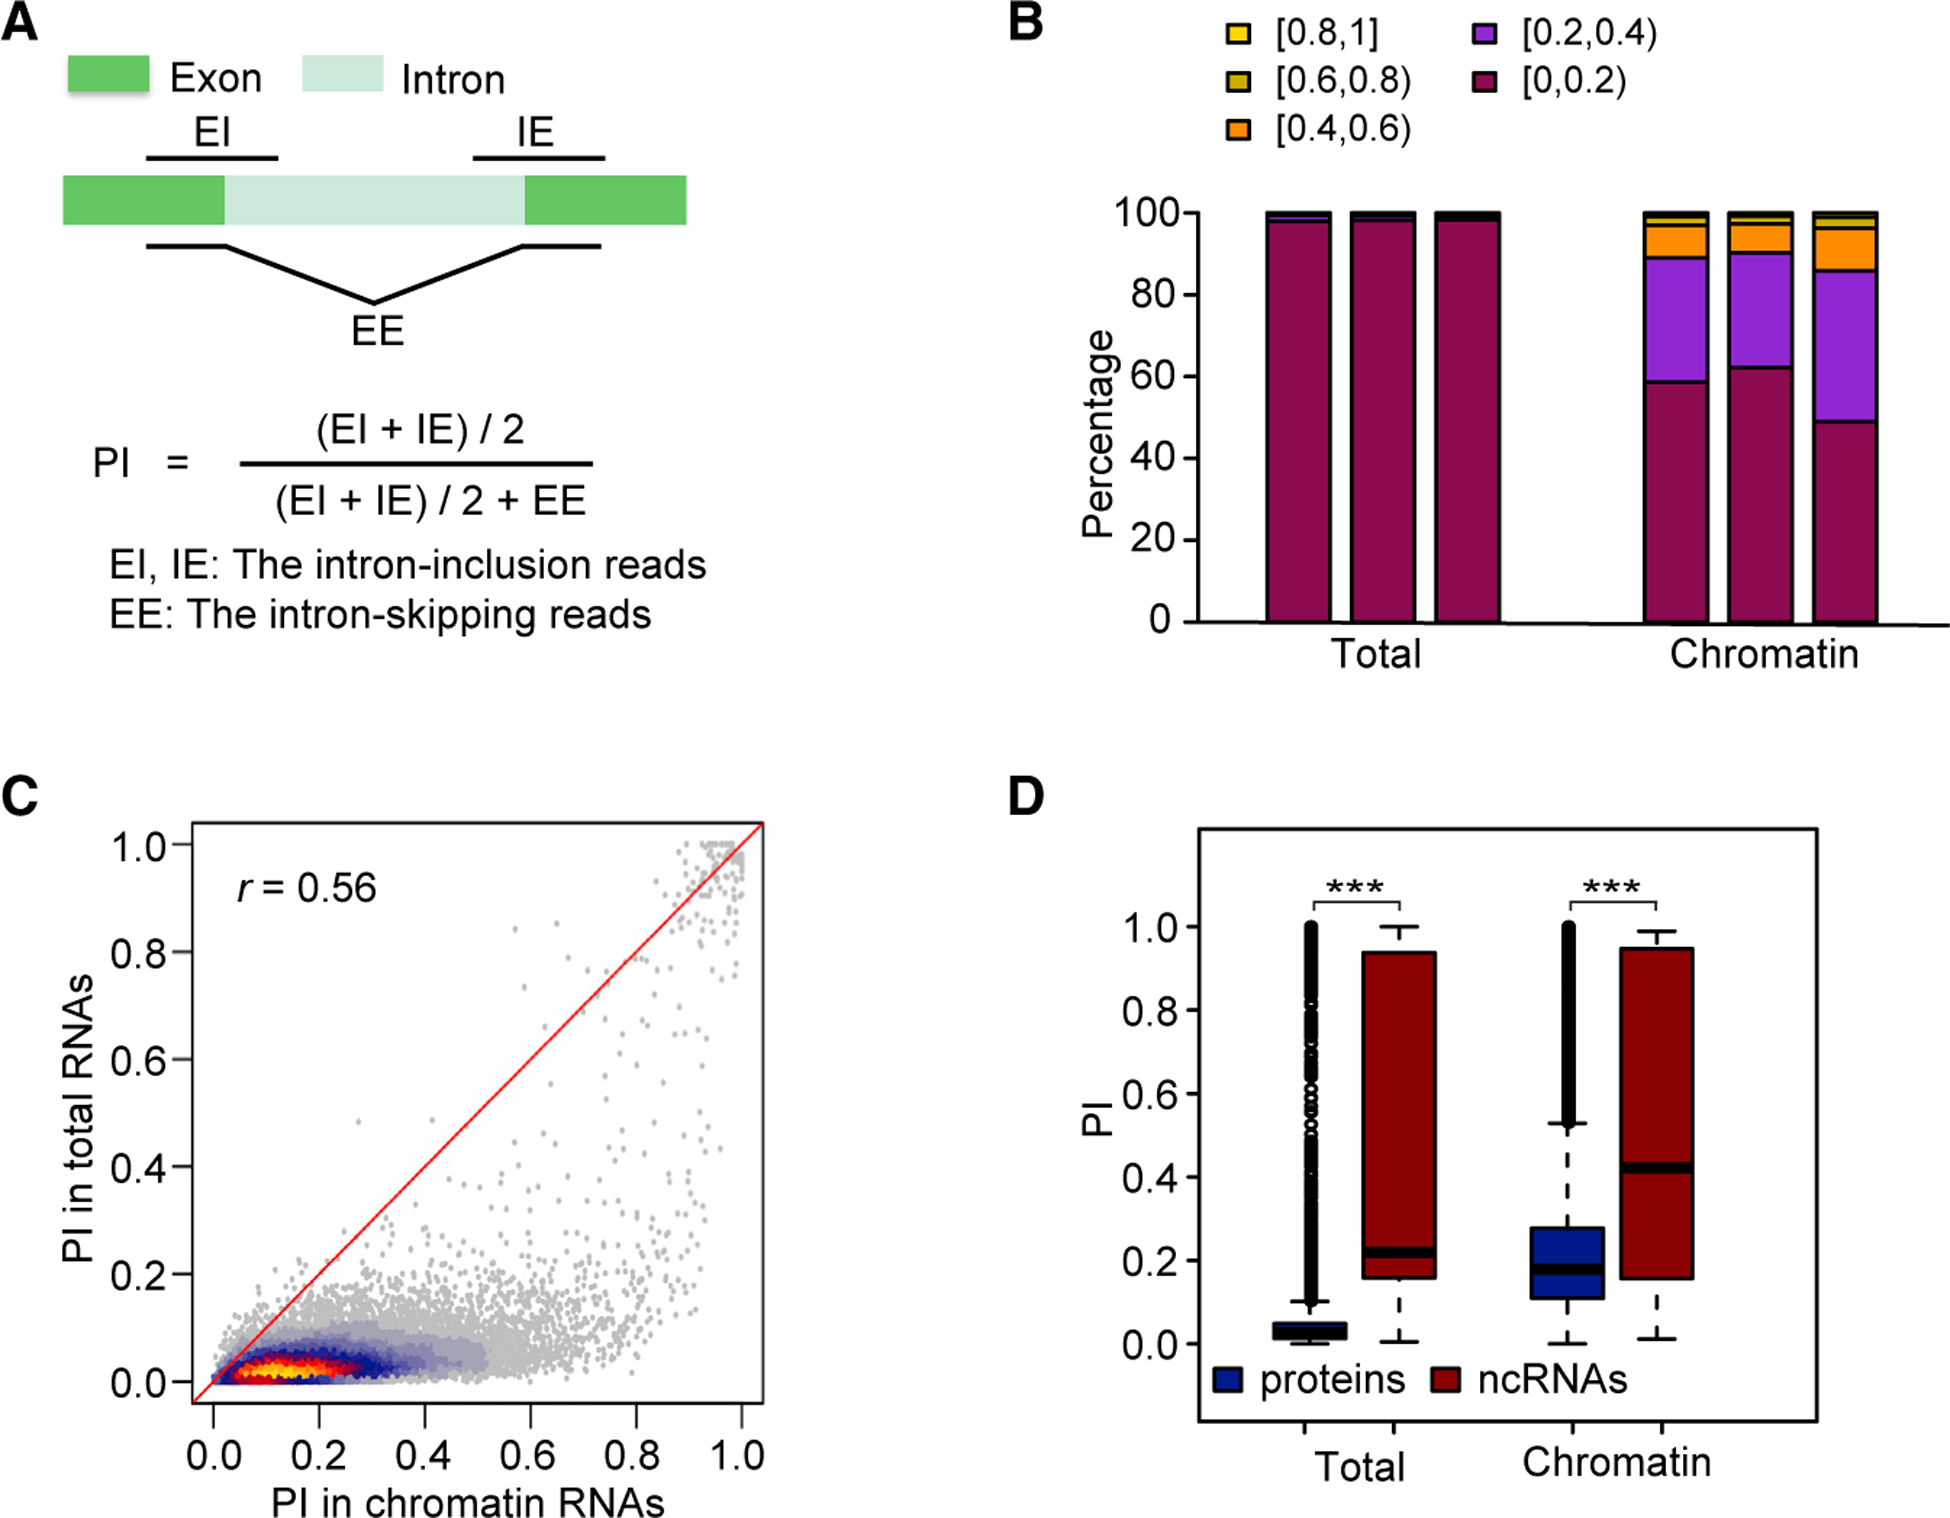
Figure 2. Global Co-transcriptional Splicing in Arabidopsis.

(A) Diagram showing the PI_Junction calculation using intron-inclusion and intron-skipping reads.
(B) Distribution of PI for three replicates (shown as three bars) of RNA-seq data from total RNAs and chromatin RNAs.
(C) Heat scatter plot showing pairwise comparisons of PI for chromatin and total RNAs. Pearson correlation coefficient (r) is at top left.
(D) Boxplot showing PI distribution for introns in protein-coding genes and in ncRNAs.
***p < 0.001 (one-tailed Wilcoxon test).
