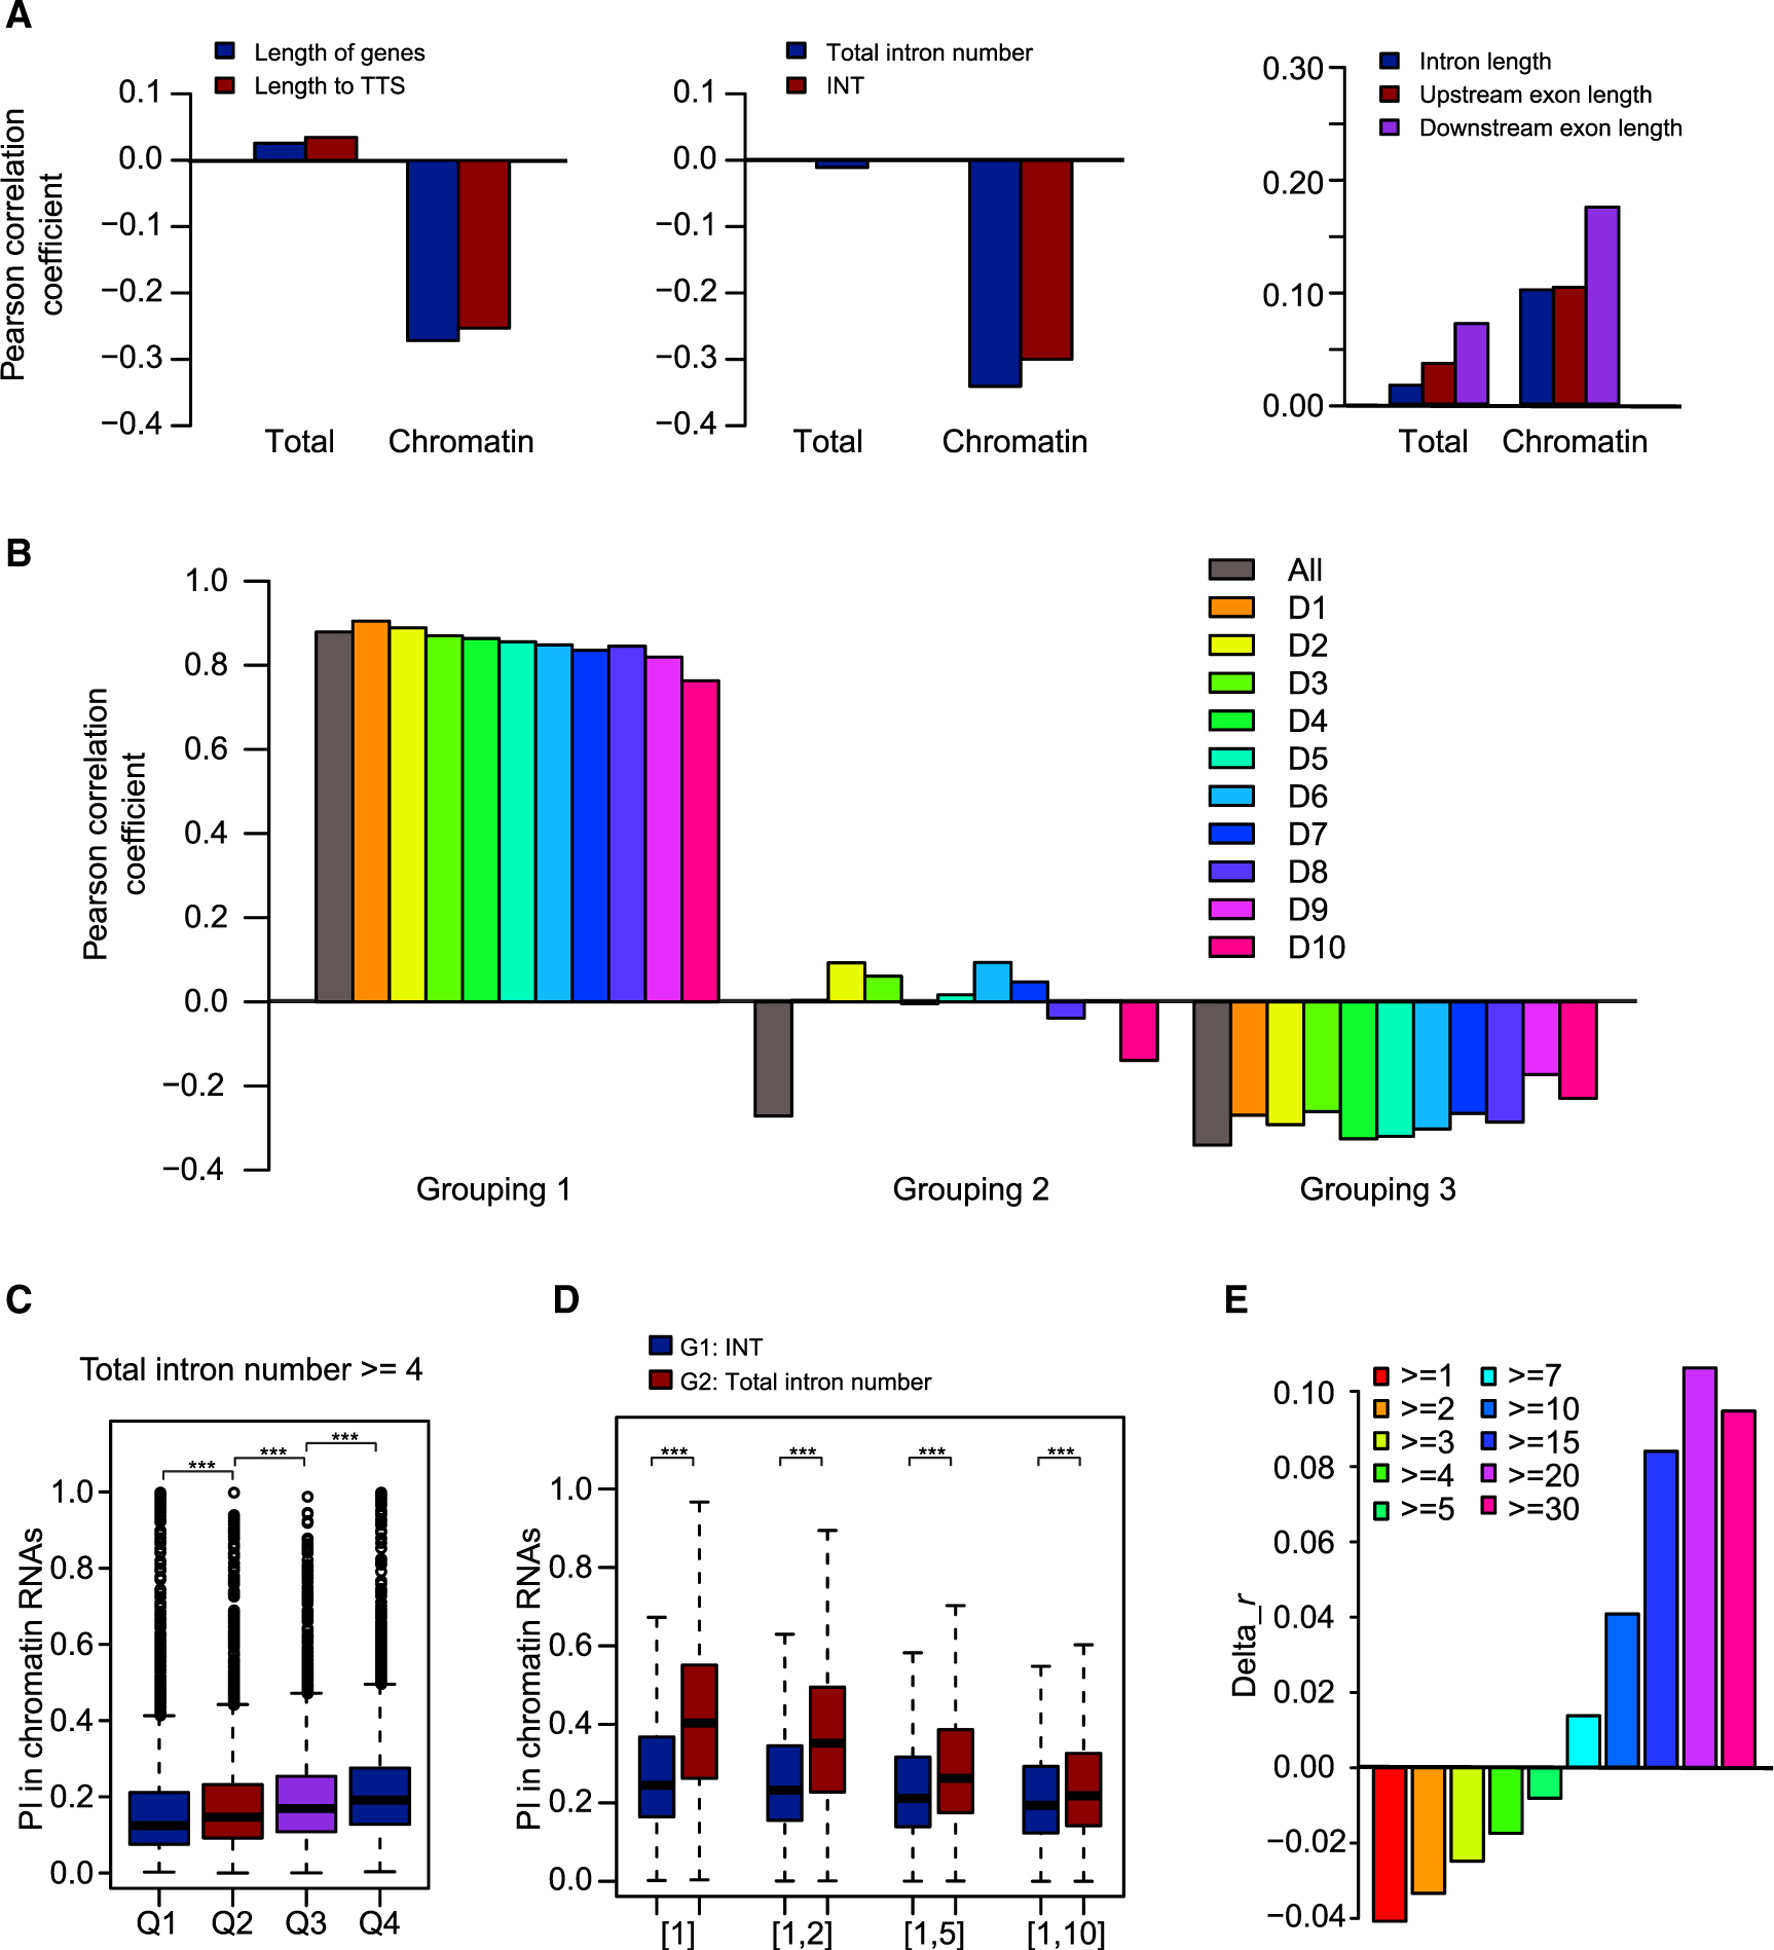
Figure 4. Predominant Roles of Total Intron Number and Intron Position in Co-transcriptional Splicing.

(A) Correlations between PI values for total and chromatin RNAs with features of introns, flanking exons, and intron-harboring genes.
(B) Pearson correlation coefficients for three groupings. In grouping 1, introns were divided into 10 deciles according to increasing chromatin RNA PI value. Correlations between total intron number and gene length were calculated for all introns and for each of the 10 deciles. In grouping 2, introns were divided into 10 deciles according to increasing total intron number. Correlations between chromatin RNA PI value and gene length were calculated for all introns and for each of the 10 deciles. In grouping 3, introns were divided into 10 deciles according to increasing gene length. Correlations between chromatin RNA PI value and total intron number were calculated for all introns and for each of the 10 deciles. All, all introns; D1–D10, the 10 deciles.
(C) All introns in genes with total intron number ≥4 were divided into four quartiles, Q1–Q4, with decreasing INT. The distribution of PI values for chromatin RNAs is shown in the boxplot.
(D) Chromatin RNA PI value/123 is shown for introns with INT (G1) or total intron number (TIN) (G2) values within certain ranges: [1], TIN/INT = 1; [1,2], 1 ≤ TIN/INT ≤2; [1,5], 1 ≤ TIN/INT ≤5; [1,10], 1 ≤ TIN/INT ≤10.
(E) Bar plot showing the difference in Pearson correlation coefficients (Pearson’s r). Delta_r was calculated as the Pearson’s r between INT and chromatin RNA PI value minus Pearson’s r between total intron number and chromatin RNA PI value.
***p < 0.001 (one-tailed Wilcoxon test).
