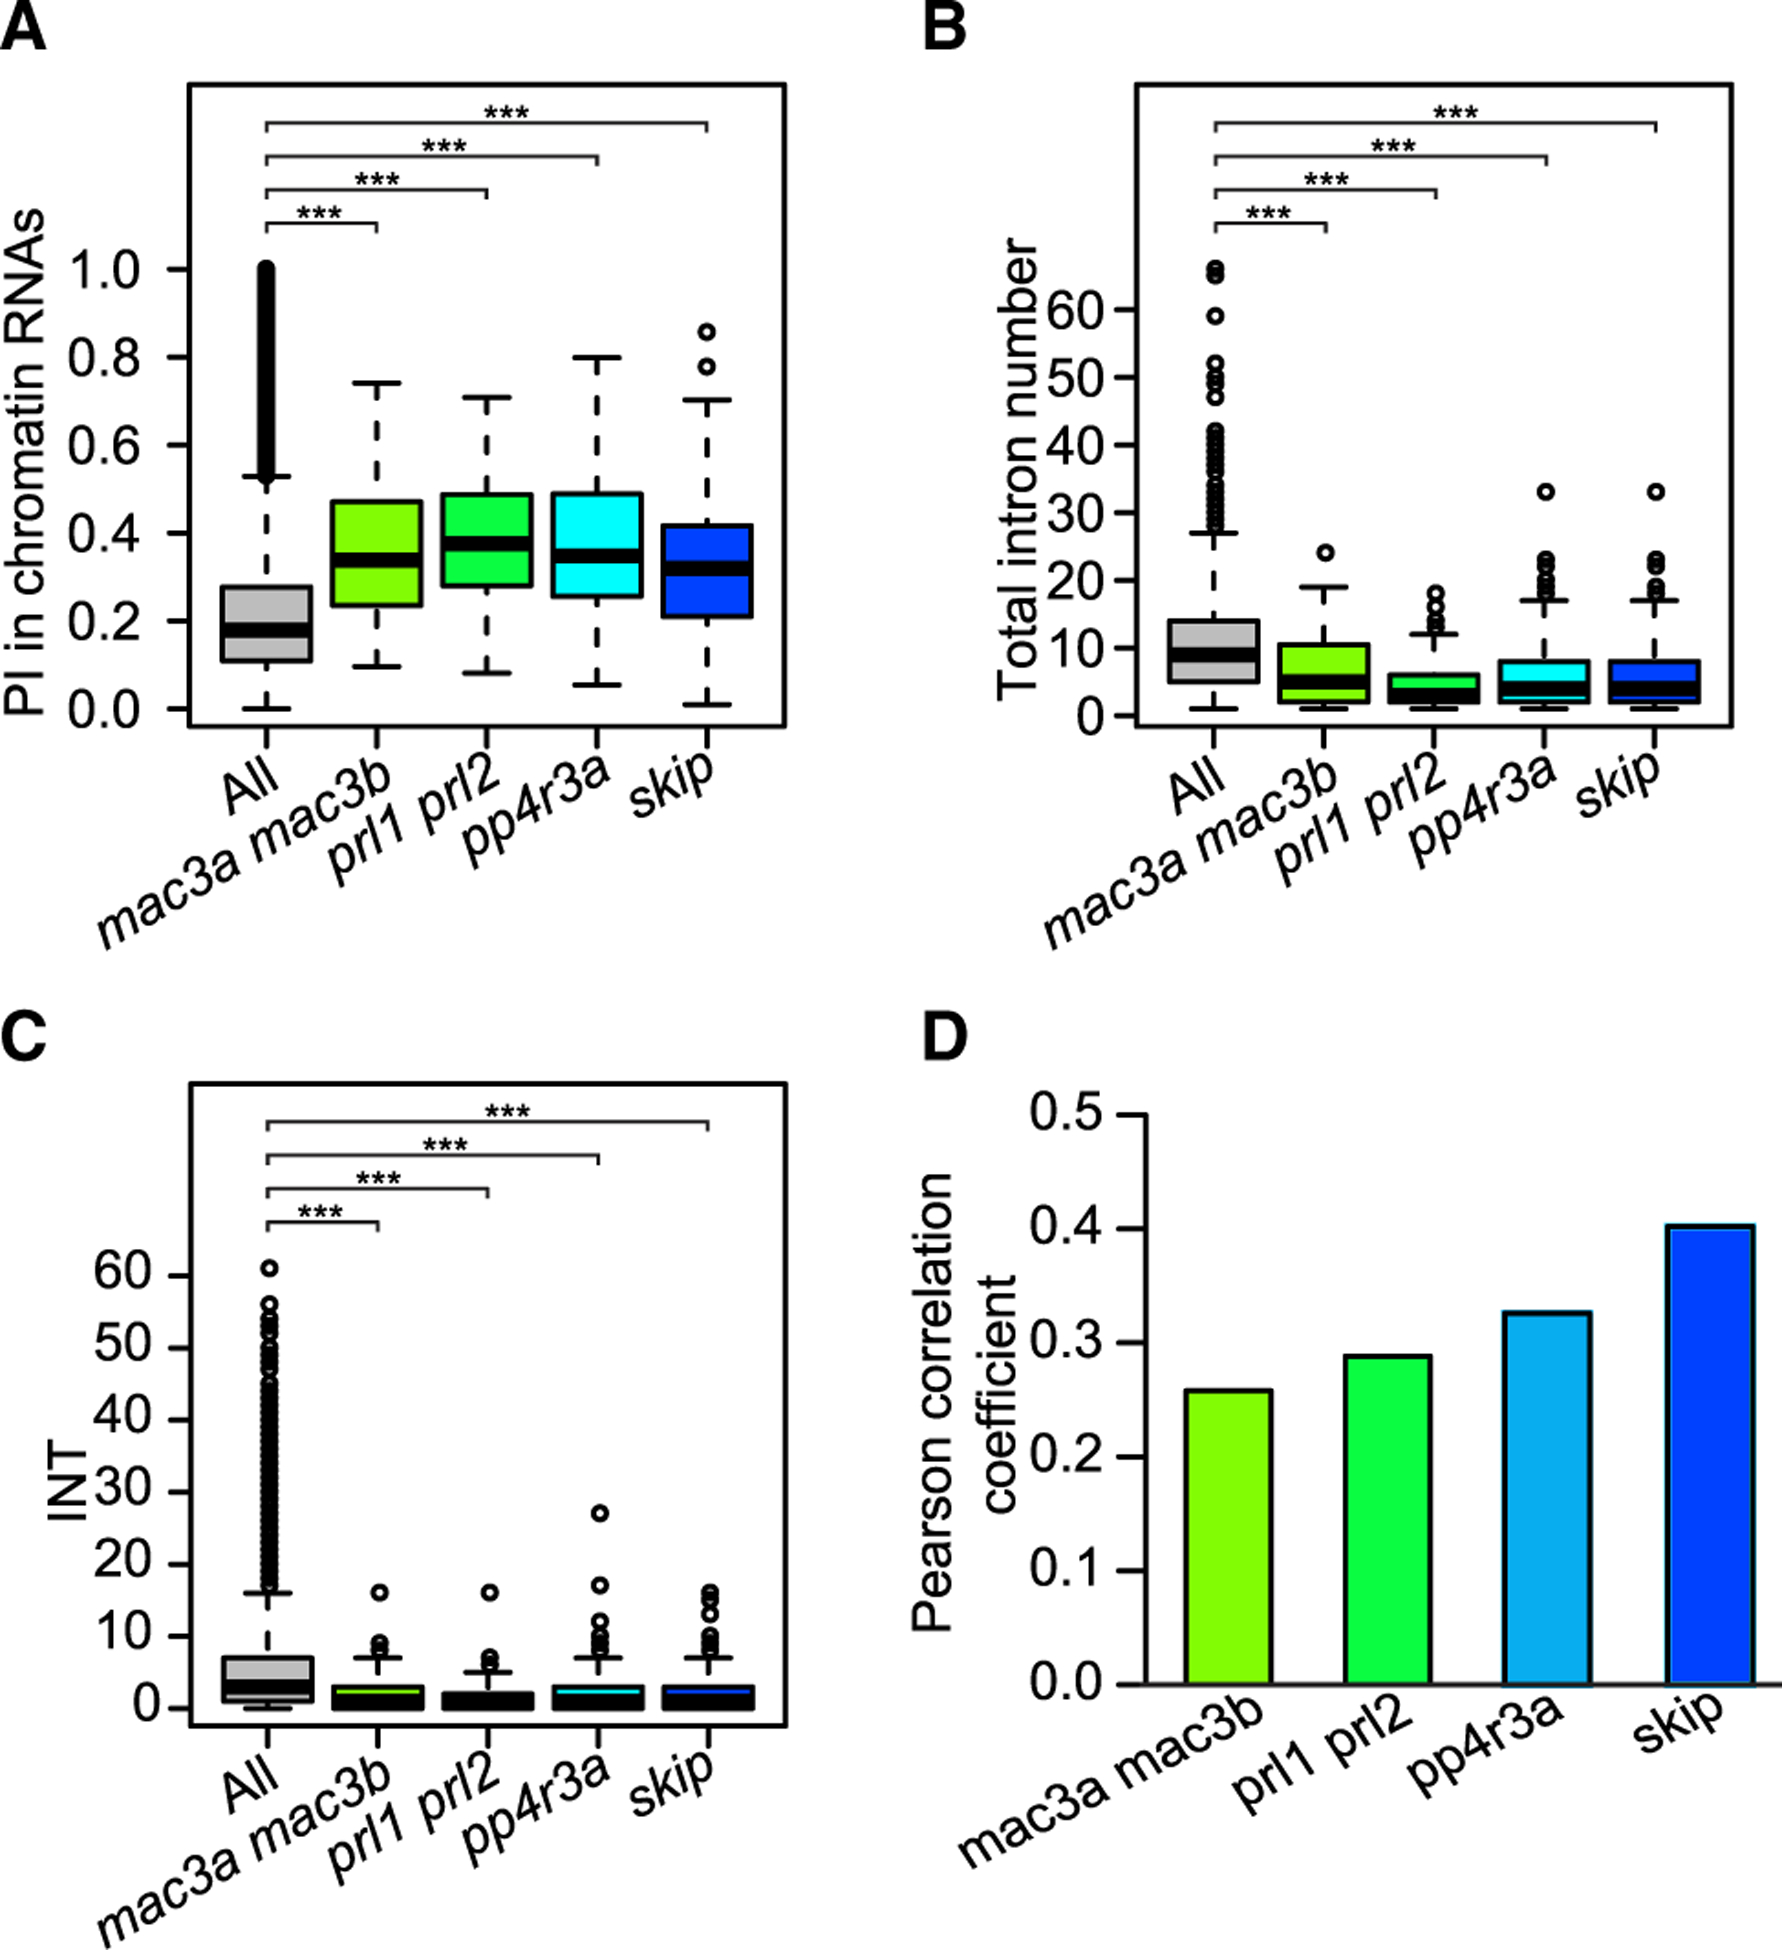
Figure 5. Introns Regulated by trans-acting Proteins in Mature RNAs Have Higher Chromatin RNA PI values.

(A–C) Boxplot showing chromatin RNA PI, total intron number, and INT values for DSIs in mac3a mac3b, prl1 prl2, pp4r3a, and skip.
(D) Bar plot showing Pearson correlation coefficients between chromatin RNA PI values and delta_PI for constitutive introns. Delta_PI was calculated as PI_Junction in mutants minus PI_Junction in wild type.
*p < 0.1, ***p < 0.001 (one-tailed Wilcoxon test).
