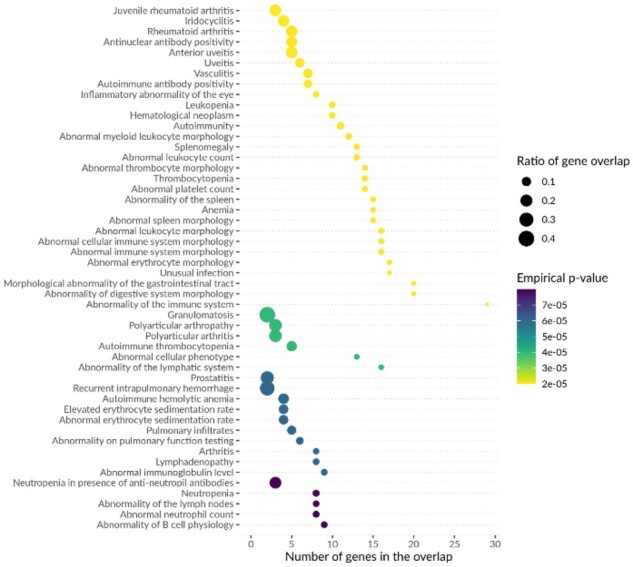
Fig. 2.

Top enrichment results for HPO terms among Mendelian disease genes located within LD-based intervals around lead SNPs in Onengut-Gumuscu et al. (2015) T1D GWAS. An example of a summary figure produced by MendelVar pipeline depicts top 50 most significant terms in the ontology (y axis), sorted first by empirical P-value followed by the number of genes overlapping the ontology term in the tested genomic intervals in case of ties (also shown independently on the x axis). The size of each data point represents ratio of gene overlap, i.e. number of genes found in the tested genomic intervals divided by all Mendelian genes annotated with that ontology term available in the genome. Each data point is coloured according to empirical P-value for enrichment significance
