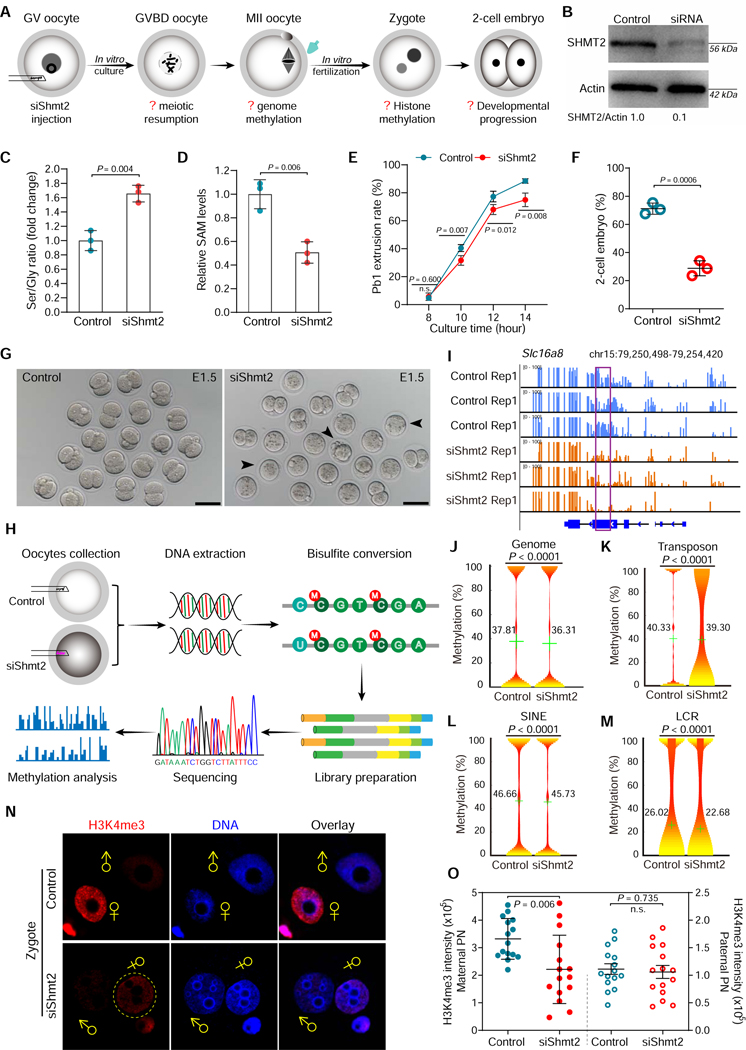
Figure 5. SHMT2 depletion impairs the epigenetic landscape in oocytes.
(A) Schematic presentation of the Shmt2 knockdown experiments. (B) Depletion of endogenous SHMT2 protein was verified by western blot analysis (200 oocytes per lane). (C) Serine-to-Glycine ratio in control (n=300) and siShmt2 (n=300) oocytes. (D) Relative levels of SAM in control (n=300) and siShmt2 (n=300) oocytes. (E) Quantitative analysis of Pb1 extrusion in control (n=102) and siShmt2 (n=105) oocytes. (F) Percentages of control (n=85) and siShmt2 (n=92) oocytes-derived embryos that develop to 2-cell stage during in vitro culture. (G) Bright-field images of E1.5 embryos derived from control and siShmt2 oocytes. Scale bars, 100 μm. (H) Flow chart illustrating the BS-Seq procedure for genome-wide methylation analysis. MII oocytes were collected and the DNA was bisulfite converted, followed by library preparation and high-throughput sequencing. (I) Graphical representation of the methylation pattern at Slc16a8 in control and siShmt2 oocytes. The highlighted region by purple box was chosen to show the significant hypomethylation in this locus following Shmt2 ablation. (J-M) Violin plots showing the methylation levels for distinct genomic features in control and siShmt2 oocytes. Mean methylation levels are indicated by the numerical value and green cross. (N) Images of control and siShmt2 zygotes co-stained with anti-H3K4me3 antibody (red) and Hoechst 33342 (blue). ♂and♀indicate paternal (PN) and maternal (MN) pronucleus, respectively. PB, polar body. (O) Quantification of H3K4me3 fluorescence shown in (N). Each data point represents a zygote (n = 15 for each group). Error bars, SD. Student’s t test was used for statistical analysis in all panels except for J-M, comparing to control. n.s., not significant. See also Figure S10.

