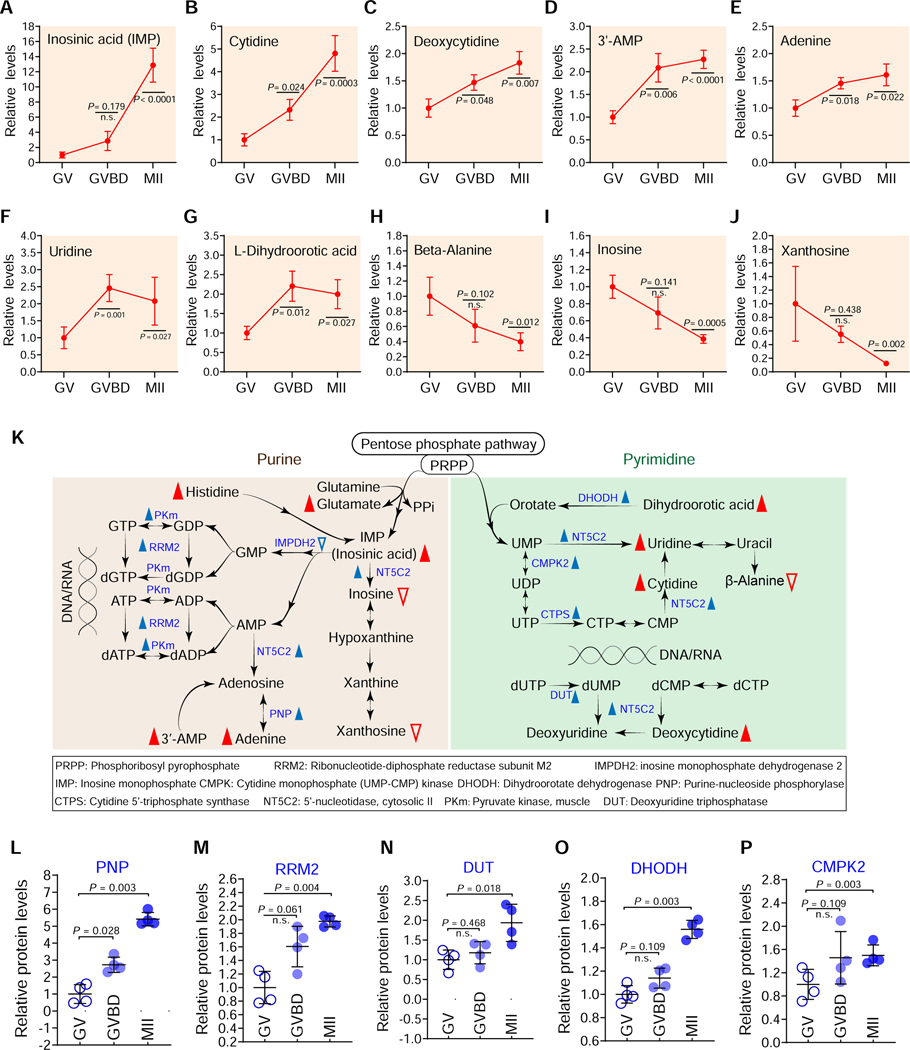
Figure 7. Nucleotide metabolism during oocyte maturation.
Relative levels of metabolites related to nucleotide metabolism in oocytes at different stages. (K) Schematic diagram of purine and pyrimidine metabolism during oocyte maturation, derived from metabolomics and proteomics. Metabolites increased and decreased in maturing oocytes are indicated by red filled and empty triangles, respectively. The blue filled and empty triangles denote metabolic enzymes that were upregulated and downregulated, respectively. (L-P) Relative abundance of the representative enzymes (PNP, PRM2, DUT, DHODH and CMPK2) involved in purine and pyrimidine metabolism. Error bars, SD. Student’s t test was used for statistical analysis in all panels, comparing to GV. n.s., not significant. See also Figures S14-S16.

