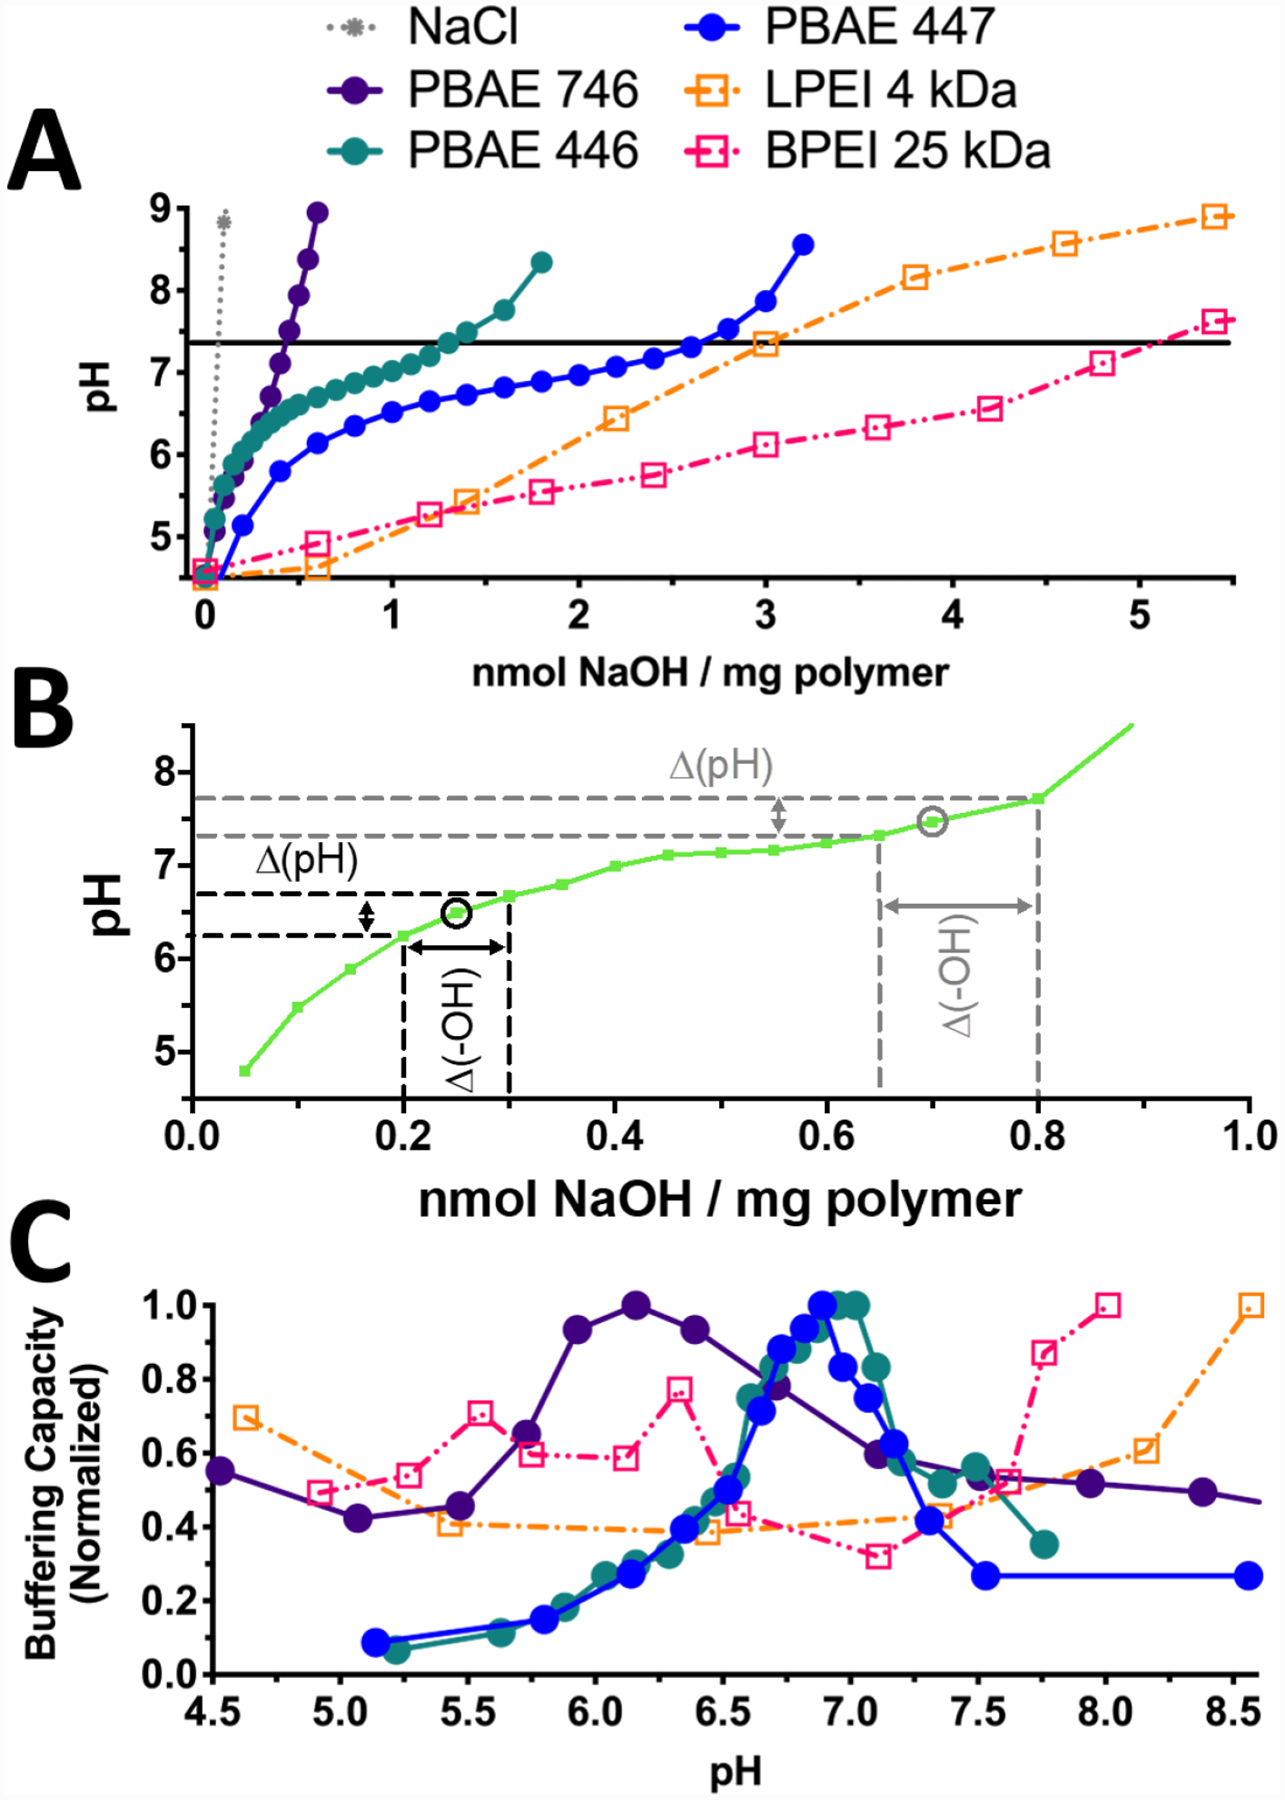
Figure 2.

PEI and PBAE are capable of buffering acidification. A) Titration curves of PEI and PBAEs 446, 447, and 746 demonstrate lower buffering capacities of PBAEs relative to PEI on a per-mass basis. B) As shown on this representative titration curve, buffering capacity at a given pH value was calculated from the slope of each pH titration curve as Δ(-OH)/Δ(pH). C) Normalization to the maximum buffering capacity in the relevant pH range (4.5–8.5) shows that PBAEs have a clear effective pKa value between pH 6–7.4 compared to both LPEI and BPEI, which are able to buffer over a broad range and lack clear effective pKa peak.
