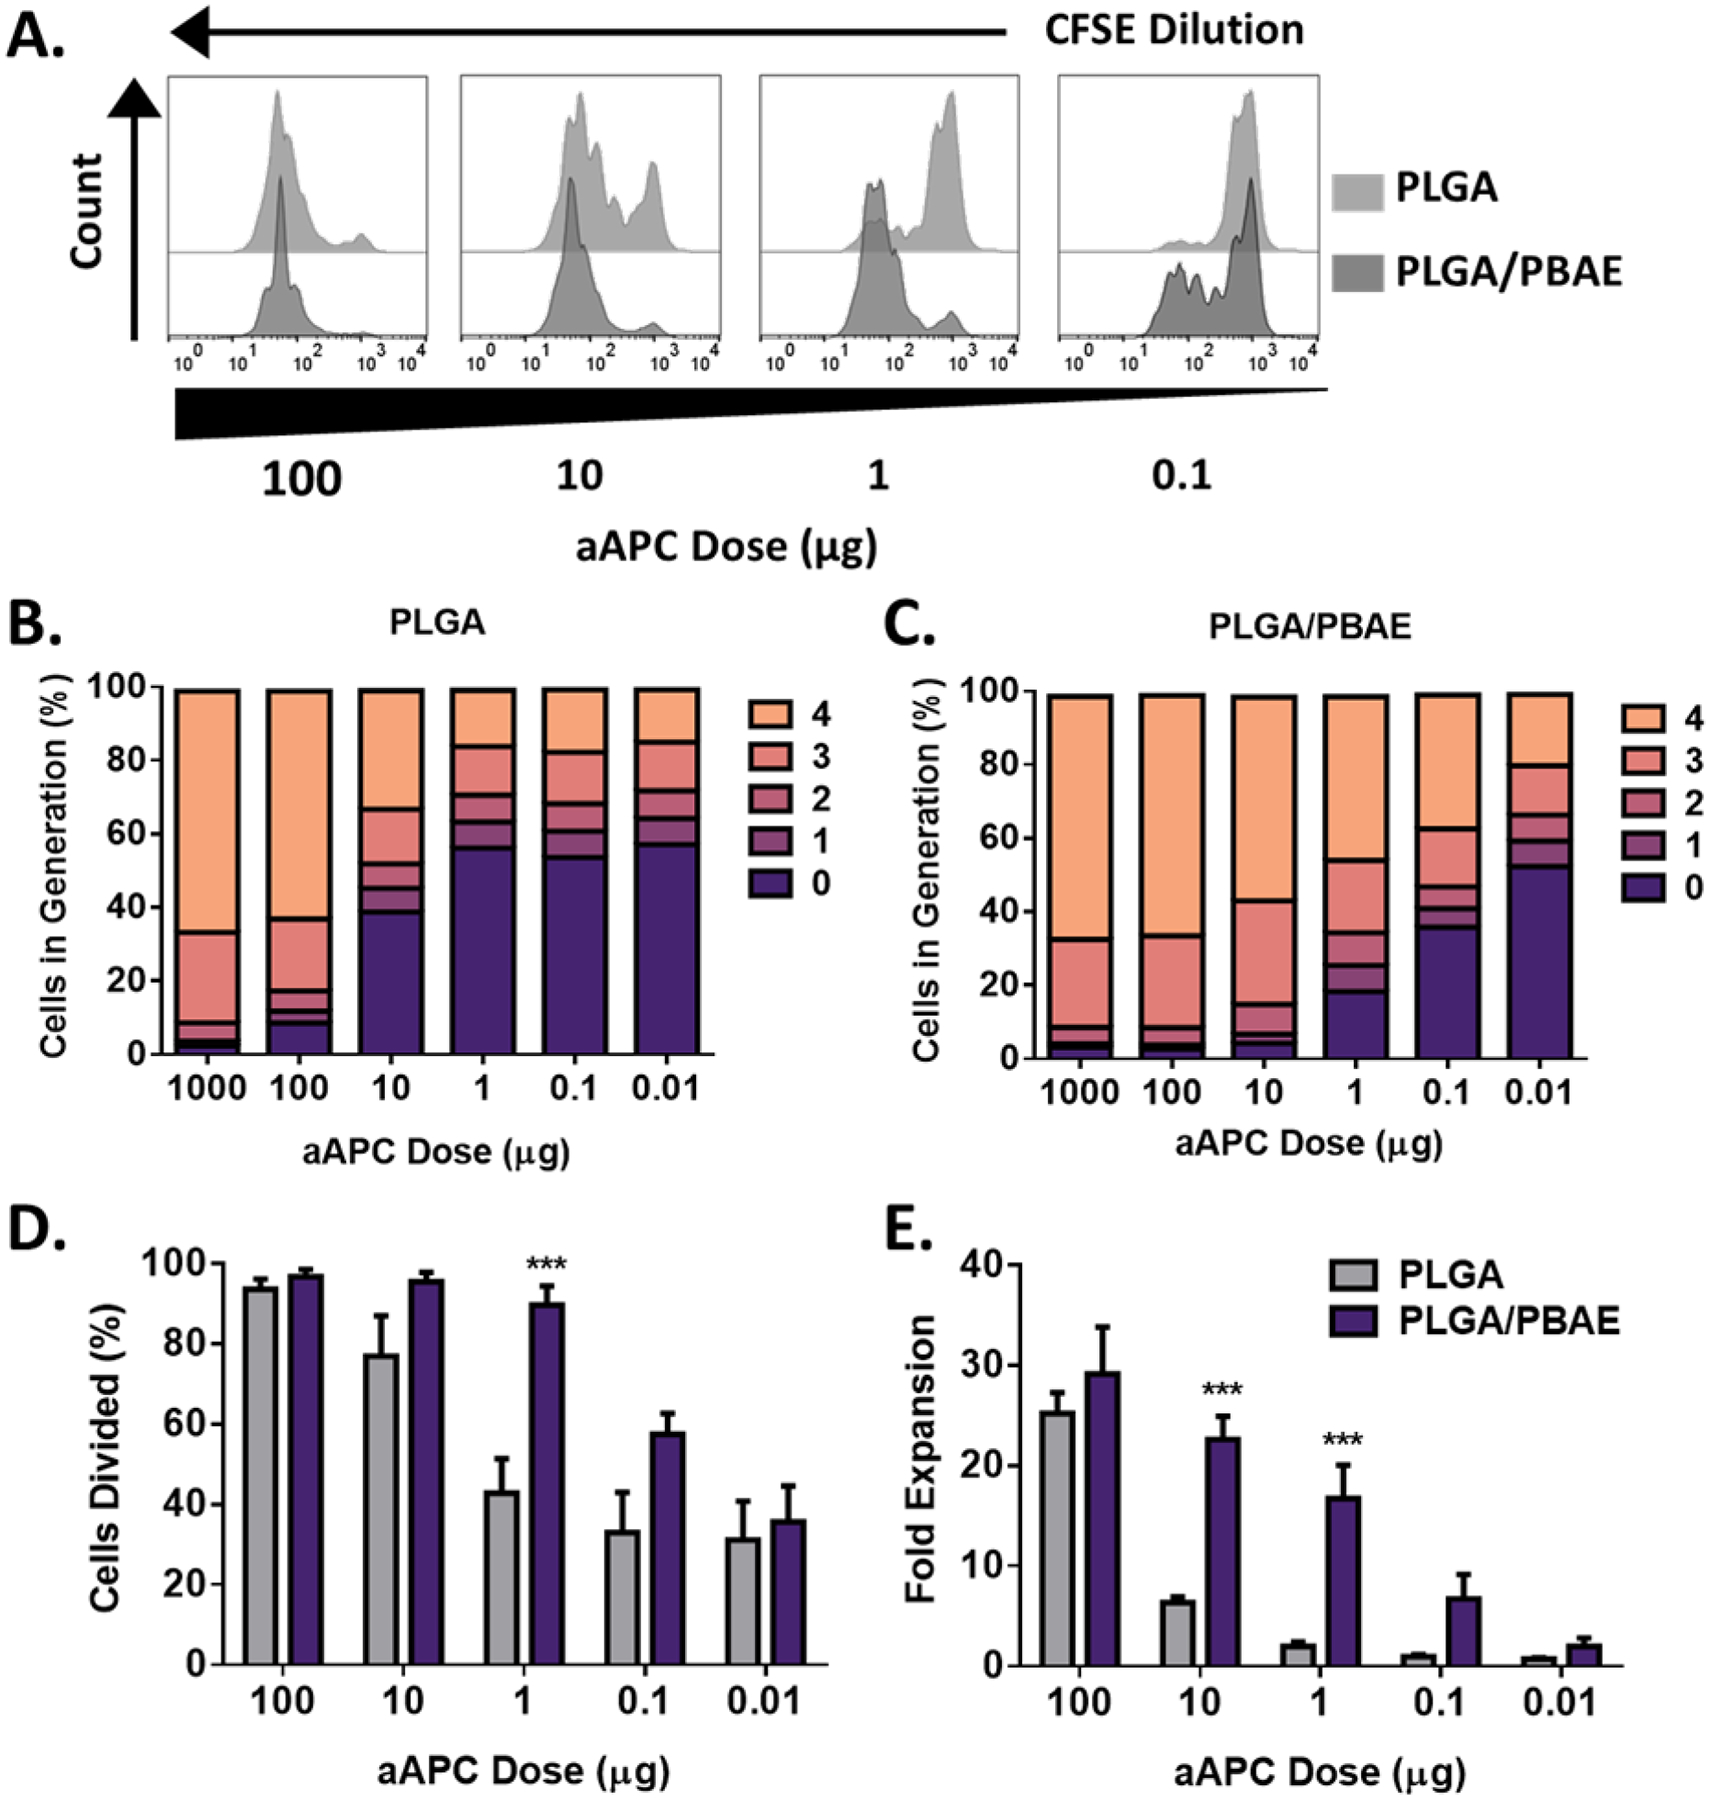
Figure 5.

PLGA/PBAE aAPC mediate higher levels of antigen-specific 2C CD8+ T cell expansion ex vivo compared to PLGA aAPC, particularly at mid-range doses. A) Representative CFSE dilution peaks over a range of PLGA aAPC and PLGA/PBAE aAPC doses. Generation analyses of B) PLGA and C) PLGA/PBAE aAPC-treated CD8+ T cells. Generations were determined by analysis of CFSE dilution peaks. D) Percent of cells divided on day 3, quantified from CFSE dilution analysis. E) Fold expansion of CD8+ T cells on day 7. Error bars in D) and E) represent the SEM of 3 replicates, (*** = p<0.001).
