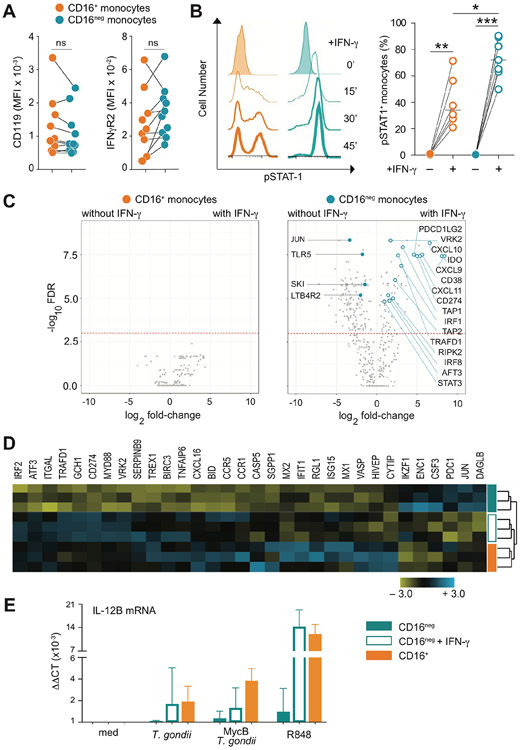
Figure 3: IFN-γ increases gene transcription only in CD16neg monocytes altering their mRNA expression profile to closely resemble that of the CD16pos monocytes at the baseline.
(A) Expression of IFN-γR1 (CD119) or R2 (IFN-γR2) is comparable between CD16neg and CD16+ monocytes. The graph depicts the mean fluorescence intensity (MFI) for each IFN-γR subunit on paired CD16+ vs. CD16neg populations for each donor (n=10). (B) IFN-γ response measured by pSTAT1 is more pronounced in CD16neg than CD16+ subset. Kinetics of pSTAT1+ monocytes measured by flow cytometry following stimulation with IFN-γ (10 ng/ml) for one representative donor (left) and frequencies of pSTAT1+ cells in CD16+ vs. CD16neg population at 20 min following IFN-γ exposure (right, n=6). (C) Pre-treatment with IFN-γ alters gene expression in CD16neg but not CD16+ monocytes. Volcano plots depict changes in gene expression in CD16+ (left) and CD16neg (right) monocytes cultured in the absence vs. presence of IFN-γ (10 ng/ml) assayed by the same NanoString panel used in Figure 1. The dotted line indicates the cutoff for statistical significance (p< 0.05) as calculated using a Benjamini- Yekutieli multiple test. Open blue symbols depict IFN-γ-upregulated genes known to be target of the cytokine and filled blue symbols show genes downregulated by IFN-γ, while brown dots indicate genes associated with metabolic pathways. (D) The gene expression profile of IFN-γ-primed CD16neg monocytes resembles that displayed by the CD16+ subset at the baseline. Heat-map of unsupervised clustering of CD16neg, IFN-γ-primed CD16neg and CD16+ monocytes from 3 healthy donors using 32 genes differentially expressed at baseline in CD16+ vs. CD16neg populations. (E) Expression of IL-12p40 measured by qRT-PCR in CD16neg, IFN-γ-primed CD16neg and CD16+ monocytes left unstimulated (med), exposed to either untreated or MycB T. gondii tachyzoites (MOI 1:1), or stimulated with R848 (300 ng/ml). The bar graph indicates median values ± interquartile range when compared to CD16neg monocytes culture in medium. *P < 0.05, **P < 0.01, ***P < 0.001.

