FIG. 2.

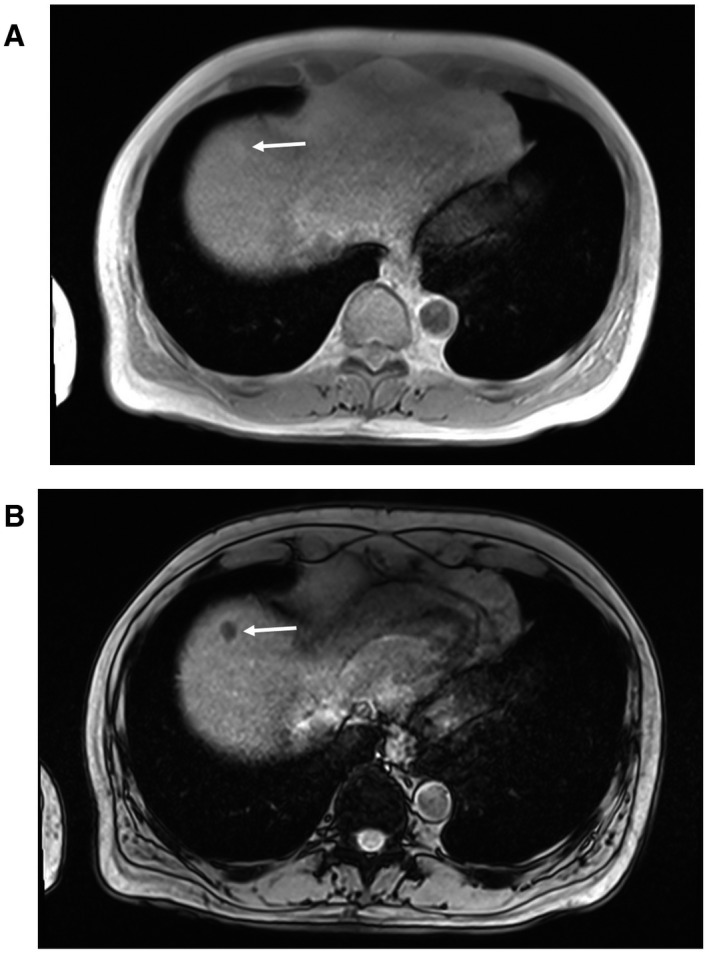
In‐phase (A) and opposed‐phase (B) chemical‐shift imaging showing signal intensity loss on the opposed‐phase in a typical steatotic HCC (white arrow).

In‐phase (A) and opposed‐phase (B) chemical‐shift imaging showing signal intensity loss on the opposed‐phase in a typical steatotic HCC (white arrow).