FIG. 2.

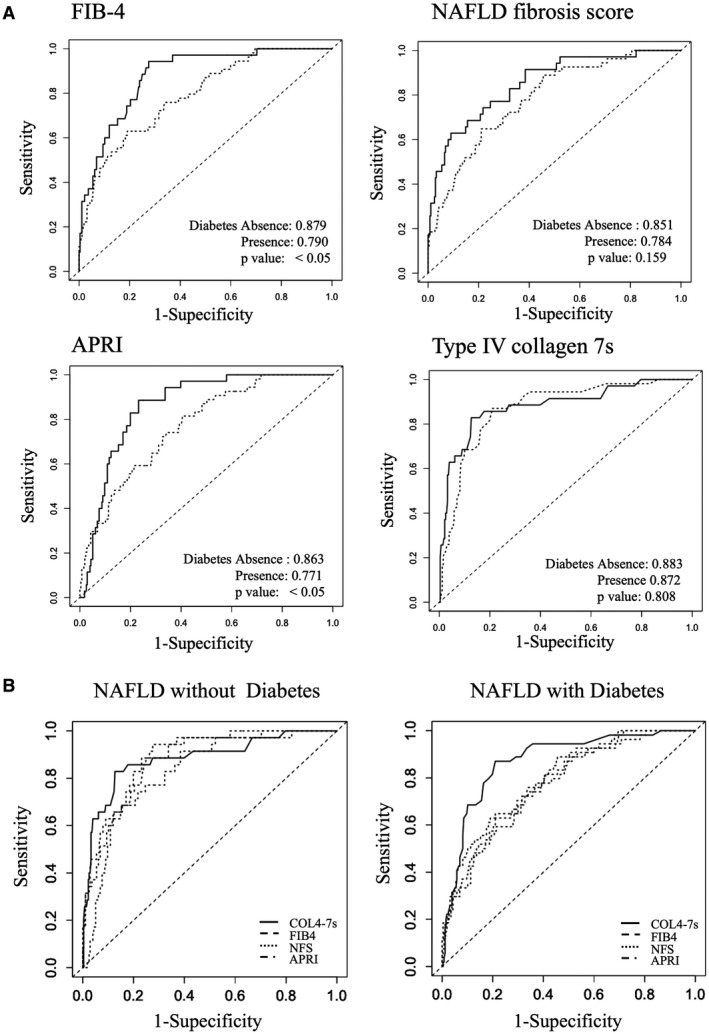
(A) ROC curve analysis of the FIB‐4 index, NFS, APRI, and COL4‐7S. The solid line indicates the absence of T2DM, and the broken line indicates the presence of T2DM. (B) DeLong test of each NIT of NAFLD with or without T2DM.

(A) ROC curve analysis of the FIB‐4 index, NFS, APRI, and COL4‐7S. The solid line indicates the absence of T2DM, and the broken line indicates the presence of T2DM. (B) DeLong test of each NIT of NAFLD with or without T2DM.