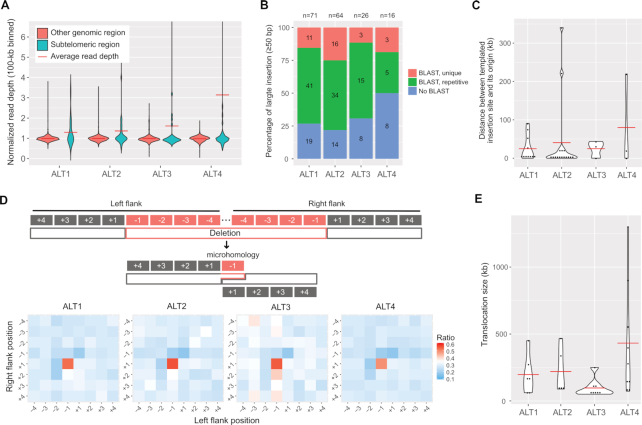
Figure 2.
Genomic changes in the four ALT survivor lines and characteristics of CNVs, insertions, deletions and translocations. (A) Violin plots representing CNV distributions in subtelomeric regions and other genomic regions are shown. Read depths were merged in 100-kb intervals and normalised by the average whole genome depths. Subtelomeric regions were defined as 200-kb regions from each chromosomal end. (B) Ratios of templated insertions to the insertions ≥50 bp. Blue bars represent insertions with no BLAST results, green bars represent those of repetitive BLAST results, and red bars represent those of unique BLAST results. The numbers in the bars represent the actual number of large insertions, and those on top of the graph represent the total number of large insertions. (C) Size distribution of distance between a templated insertion site and its origin is shown. Red horizontal bar represents the average distance. (D) Microhomology between deletion junction sites. Top: Schematic representation of possible polymerase theta-mediated end joining (TMEJ). Typical microhomology between left flank −1 and right flank +1 positions can be achieved by TMEJ. Bottom: Heatmaps represent the ratio of the same sequences between each position pair in all ≥10-bp deletions. (E) Size distribution of >50-kb translocation. Red horizontal line represents the average size of each line.

