
Figure 3.
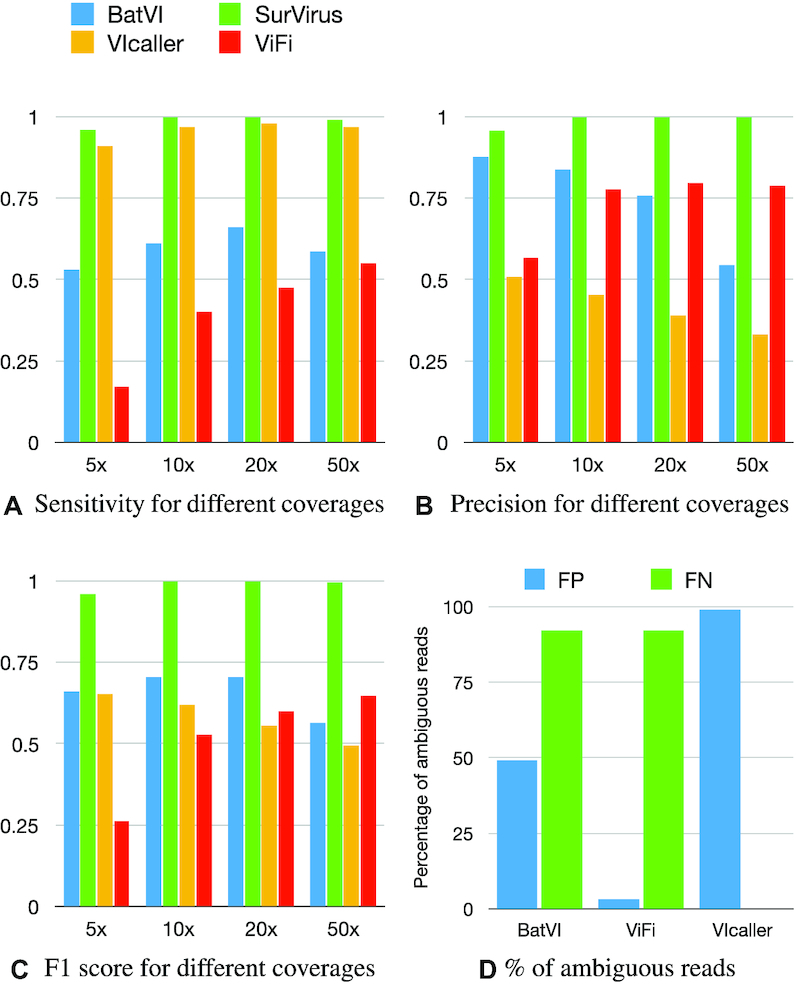
(A–C) The performance of the three tested callers plus SurVirus, on the REPSIM datasets at different coverage. A simulated integration is considered as predicted if the predictions is within 100 bp from it. (D) Percentage of ambiguous reads in false positives (blue) and false negatives (green) for each caller.