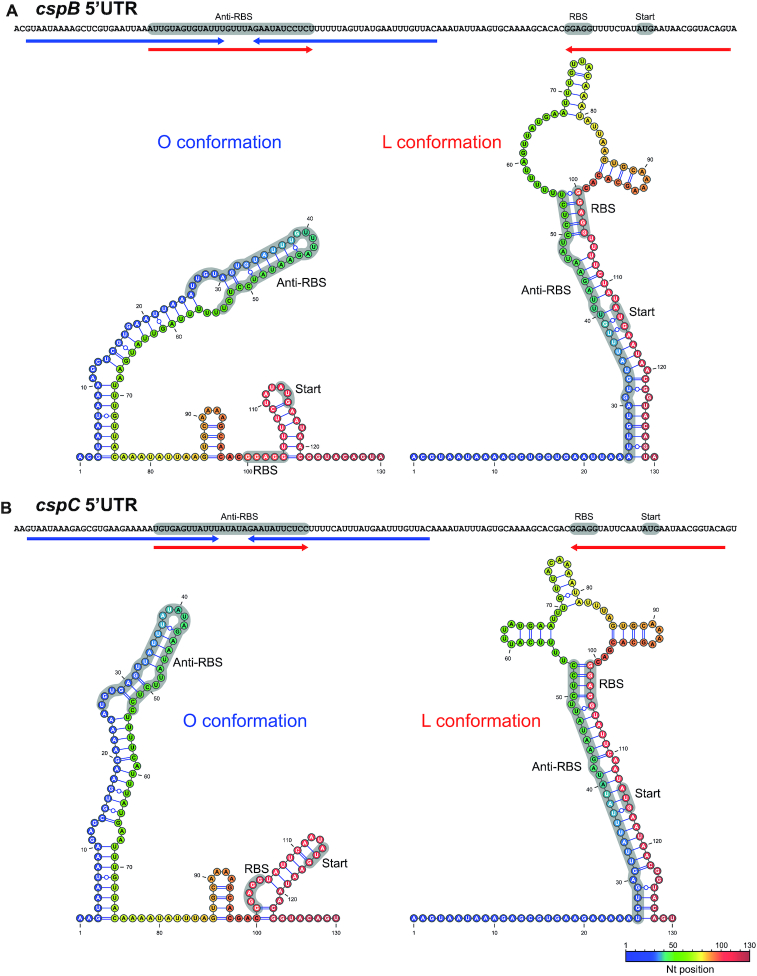
Figure 3.
Putative alternative structures adopted by the cspB and cspC 5′UTRs. RNA structures were predicted using the mfold web server tool (38) and visualized and drawn with the VARNA software (39). Colours represent nucleotide positions within the RNA. Blue and red arrows below the 5′UTR sequences indicate the interacting nucleotide regions in the O and L conformations, respectively. The RBS sequence, the start codon and the anti-RBS region appear as grey shaded areas.

