Figure 7.
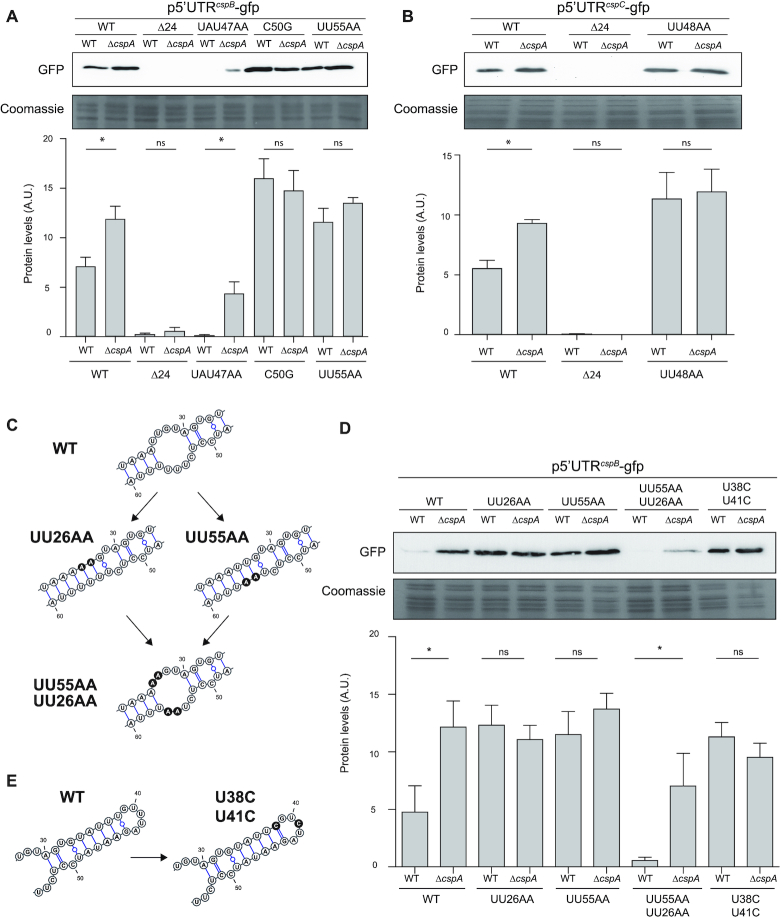
CspA is required for promoting the L conformation at 37°C and repressing CspB and CspC production. (A, B and D). Western blots showing the GFP levels from the WT and ΔcspA strains expressing the WT and mutated cspB or cspC 5′UTR-GFP reporter plasmids. Total protein extracts were processed as described in Figure 2. Coomassie gel portions are included as loading controls. Bar plots represent the mean and standard deviation of the GFP levels from three independent biological replicates, which were determined by densitometry of protein bands using ImageJ (https://imagej.nih.gov/ij/). Asterisks represent statistical significance (P < 0.05, Mann–Whitney U test); ns, not significant. Representative images from the triplicates are shown. (C and E). Schematic representations of the mutations introduced in the cspB 5′UTR. The substituted nucleotides are shaded in black.

