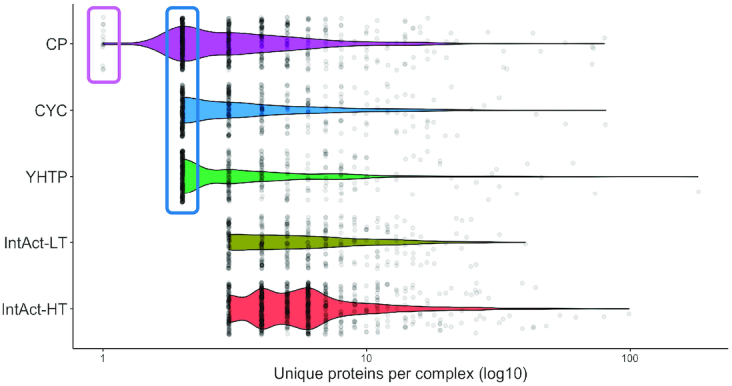
Figure 2.

Distribution of number of unique proteins per complex. Homomers are found in the small rectangle and heterodimers in the large rectangle. Total number of complexes per dataset: CP = 589, CYC = 408, YHTP = 400, IntAct-LT = 332, IntAct-HT = 689
