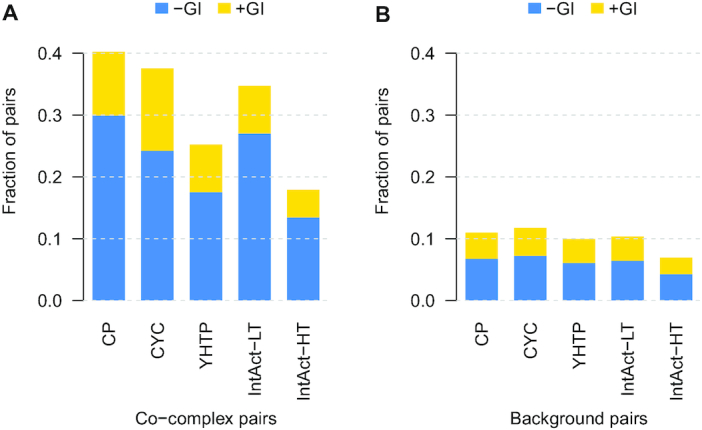
Figure 5.

(A) Fraction of co-complex pairs from each complex dataset that overlaps with negative (dark bars) and positive (light bars) genetic interactions. (B) Fraction of protein pairs from each complex dataset that do not occur in the same complex (= background pairs) that overlaps with negative (dark bars) and positive (light bars genetic interactions.
