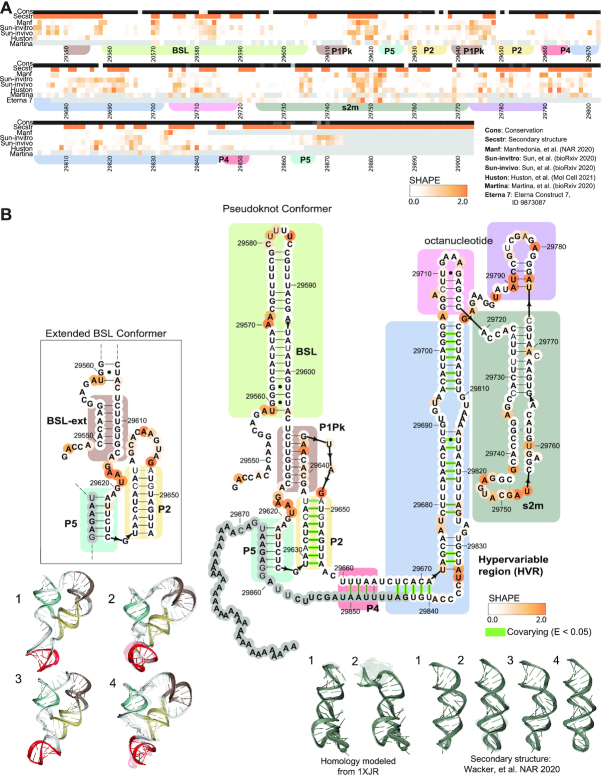
Figure 4.
3′ UTR chemical reactivity, secondary structure, and 3D models. (A) The heatmap compares chemical reactivity from recent publications probing SARS-CoV-2 RNA (3,5,6,8,16) along with reactivity data collected in this work. Gray values indicate no data, and reactivity increases from white to orange. The conservation track indicates the conservation percentage for each nucleotide across SARS-related species from white (0% conserved) to black (100% conserved.) The secondary structure track is white in paired regions and orange in unpaired regions. Domains are indicated with colored boxes matching their coloring in 3D models. (B) Positions are colored according to their chemical reactivity in Manfredonia et al. (8) Regions are boxed according to their coloring in 3D models. In bold are positions that are completely conserved across a set of SARS-related virus sequences. Base pairs that are not identified by the integrated DMS mapping and NMR analysis of Wacker et al. (39) are shown in grey. Base pairs found to have significant co-variance across coronaviruses in Mafredonia et al. (8) (E-value less than 0.05) are highlighted in green. 3D models are shown for the top 4 clusters for a segment containing the 3′ UTR pseudoknot, P2 and P5. 3D models are also shown for the top 4 clusters for the stem–loop II-like motif with models based on the NMR-derived secondary structure (39), and the top 2 clusters for the stem–loop II-like motif, with models built based on homology to template structure 1XJR (12). The top-scoring cluster member in each case is depicted with solid colors, and the top cluster members (up to 10) are depicted as transparent structures.

