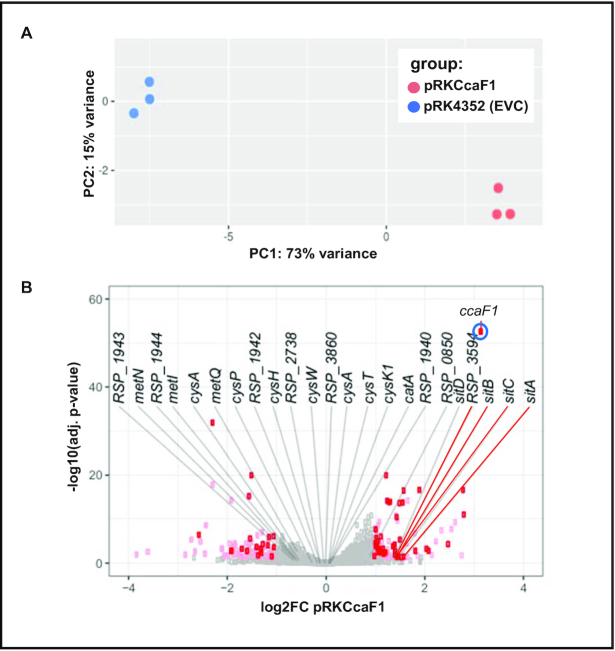
Figure 6.
Overexpression of CcaF1 impacts the R. sphaeroides transcriptome. (A) A principal component analysis was performed as part of the downstream DESeq2 analysis. The scatterplot shows two distinct groups, each one harbors the replicates belonging to one of the individual strains used in this study. (B) Volcano plot for the comparison of the ccaF1 overexpressing strain and the wild type, based on RNAseq data. Genes with significant change in abundance are colored red (adjusted P-value ≤ 0.05, log2fold change ≤–1 or ≥1, basemean > 100) and pink (adjusted P-value ≤0.05, log2fold change ≤–1 or ≥1, basemean ≤ 100). Gray dots: adjusted P-value >0.05. The 24 RNAs with highest enrichment in the CoIP are labelled.

