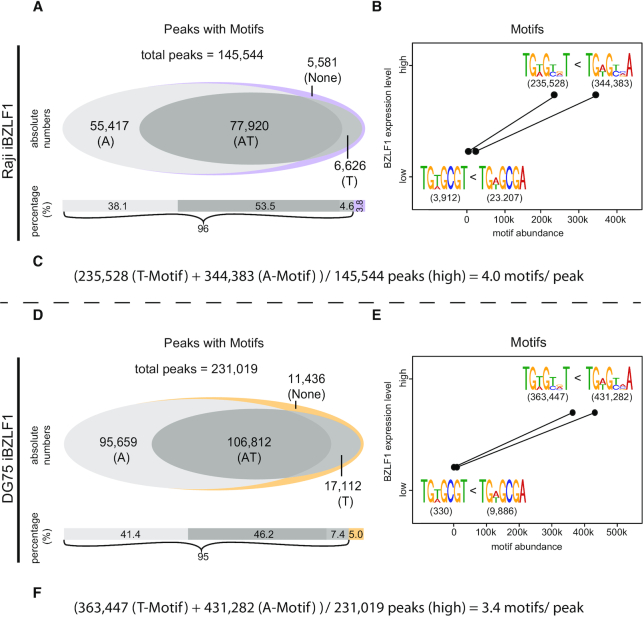
Figure 2.
Motif abundance as a function of BZLF1 levels in Raji and DG75 iBZLF1 cells. (A, D) The Venn diagram shows the number of peaks that contain either the TGWGYVA (A) or the TGWGYVT (T) motifs, both (A/T) or no identifiable motif (none). In Raji and DG75 iBZLF1 cells at 15 h BZLF1 levels 54 % and 46 % of the peaks contain both motifs (A/T), respectively. Within 96 % and 95 % of all peaks in Raji and DG75 iBZLF1 cells, respectively, at least one motif could be identified. (B, E) The number of the four BZLF1 binding motifs found in ChIP-seq peaks is plotted at 0 h and 15 h expression levels of BZLF1. At both levels and in both cell lines, the number of motifs ending with the residue A exceeds the number of motifs ending with T. The finding suggests that BZLF1’s ranked motif preference is TGWGCGA > TGWGCGT > TGWGYVA > TGWGYVT. (C, F) Calculation of the number of motifs per peak.

