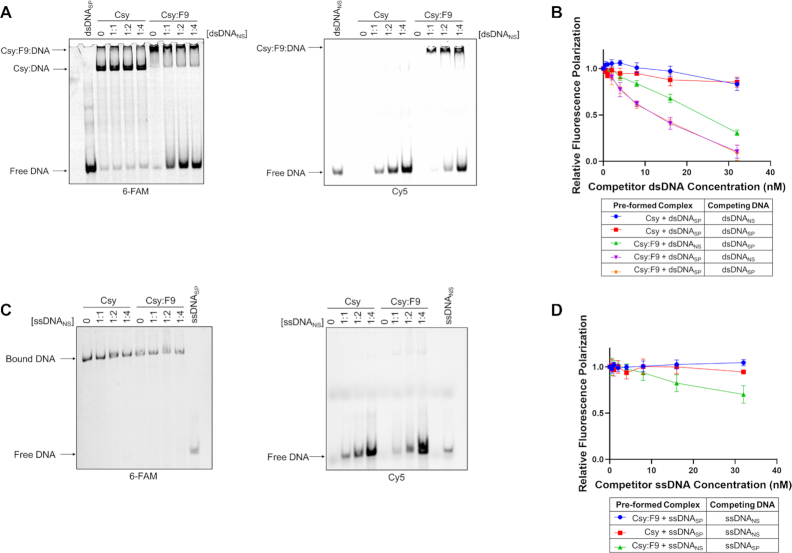
Figure 3.
DNA binding competition assays. (A) Csy or Csy:F9 complexes (1000 nM) were pre-saturated with 300 nM 6-FAM labeled dsDNASP, then increasing concentrations of Cy5-labeled dsDNANS were added as competitor. DNA-binding was monitored by EMSA. The ratio of dsDNASP to dsDNANS is shown over each lane. The same gel was irradiated at 473 nm to visualize the 6-FAM-labeled DNA (left panel) and at 673 nm to visualize the Cy5-labeled DNA (right panel). (B) Csy or Csy:F9 complexes were pre-mixed with Cy5-dsDNA at 4 nM then competed with increasing concentrations of unlabeled dsDNA as indicated on the x-axis. Relative fluorescence polarization (y-axis) is the FP value at each competitor concentration divided by the value observed in the absence of competitor DNA. (C) Competition experiments are similar to (B) except that experiments were performed with specific or non-specific ssDNA. (D) These competition EMSA experiments are similar to (A) except that complexes were pre-saturated with 6-FAM-labeled ssDNASP and the competitor was Cy5-labeled ssDNANS. The error bars in (B) and (D) correspond to SD, n = 3.

