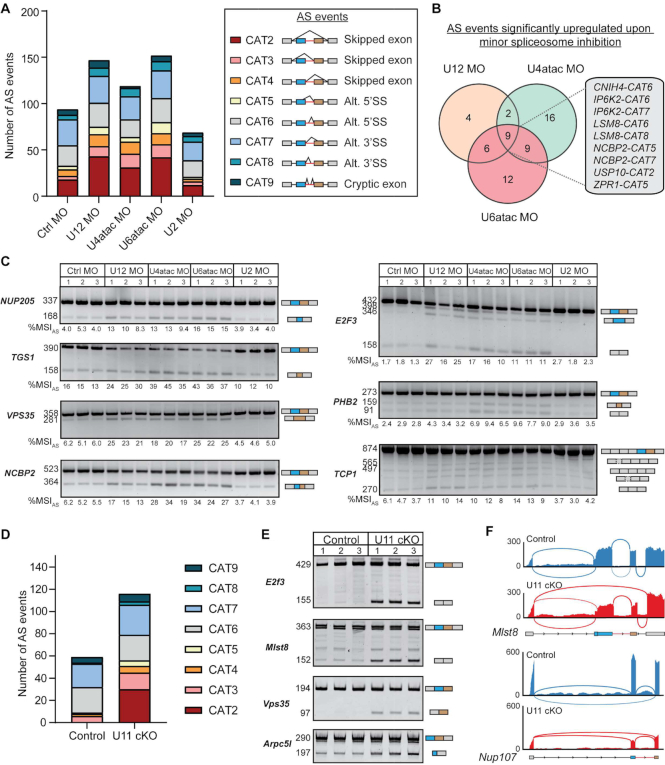
Figure 1.
Inhibition of each minor spliceosome snRNA results in elevated AS around minor introns. (A) Bar graph with number of AS events around the minor introns in each morpholino (MO) condition. The different types of AS corresponding to the color codes are shown on the right. The investigated AS events are also schematized on the right, where the minor intron is colored red and the flanking upstream and downstream exons are colored blue and brown, respectively. CAT = category; Alt = alternative; SS = splice site. (B) Venn diagram showing the overlap of minor introns with significant upregulation of AS upon inhibition of the minor spliceosome. The AS events that are significantly upregulated in all three conditions are shown on the right. (C) Agarose gel images of RT-PCR products resulting from AS around minor introns. Product size (in base pairs) of Sanger-sequenced products is shown on the left; product schematics are shown on the right. The %MSIAS was calculated using ImageJ. (D) Bar graph with number of AS events around the minor intron in U11 cKO embryos. (E) Acrylamide gel images of RT-PCR products resulting from AS around minor introns. Product size (in base pairs) of Sanger-sequenced products is shown on the left; product schematics are shown on the right. (F) Sashimi plots showing combined AS usage around minor introns. See also Supplementary Figures S1–S3.

