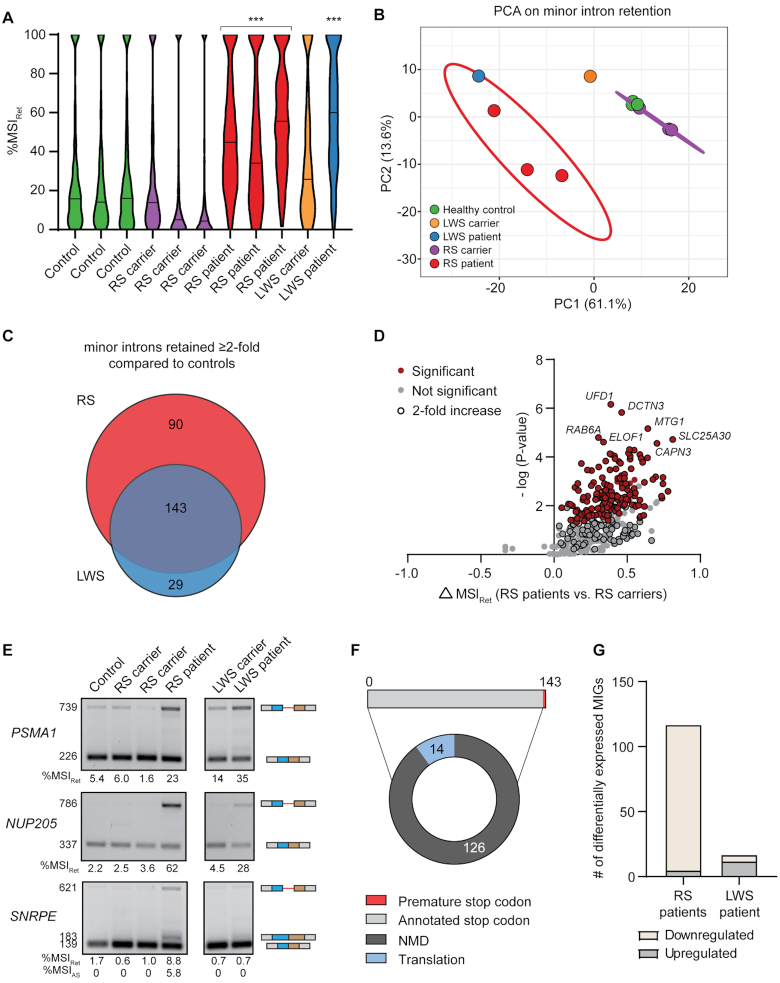
Figure 5.
Minor intron retention occurs more frequently in Roifman syndrome than Lowry–Wood syndrome. (A) Violin plots of the %MSIRet for all retained minor introns in each individual. Solid line denotes median. Statistical significance was determined by the Kruskal–Wallis test, followed by the post-hoc Dunn test. ***P < 0.001. (B) PCA on %MSIRet values in patients and controls. Prediction ellipse is drawn such that the probability is 95% that a new observation from the same condition falls inside the ellipse. (C) Venn diagram of the number of minor introns with elevated retention in the RS and LWS patients compared to healthy controls and the respective carriers. (D) Volcano plot of MIGs with minor intron retention in RS. (E) Agarose gel images of RT-PCR products resulting from minor intron retention in PBMCs. Product size (in base pairs) of products is shown on the left; product schematics are shown on the right. The %MSIRet was calculated using ImageJ. (F) Pie chart with effect of minor intron retention on the ORF and fate of MIG transcripts. (G) Bar graph with number of differentially expressed MIGs in the RS patient and LWS patients compared to healthy control. RS = Roifman syndrome; LWS = Lowry–Wood syndrome; NMD = nonsense-mediated decay. See also Supplementary Figure S8.

