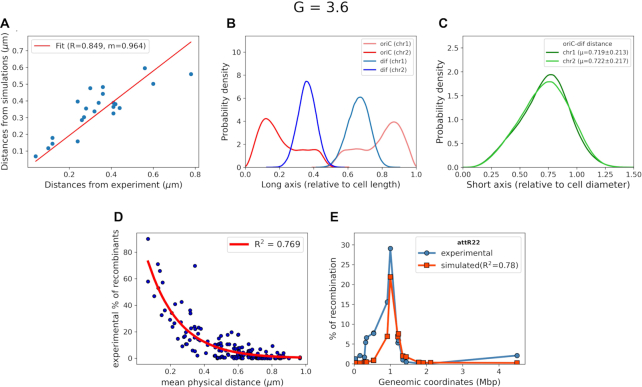
Figure 4.
(A) Distances measured from our simulations (y-axis) for Hi–C data of E. coli at 37°C in LB media versus distances measured via fluorescence microscopy (x-axis), measured at 25°C in Minimal media. (B) Position distribution of oriC and dif with respect to the cell long axis. (C) Distribution of distance between oriC and dif relative to cell diameter. (D) Comparison between the recombination frequencies provided by Valens et al. (9) versus mean physical distance between recombination loci and red line indicates the single exponential fit. (E) A representative plot of recombination frequencies predicted by mean physical distance, blue: experimental data and red: predicted by simulated data.

