Figure 6.
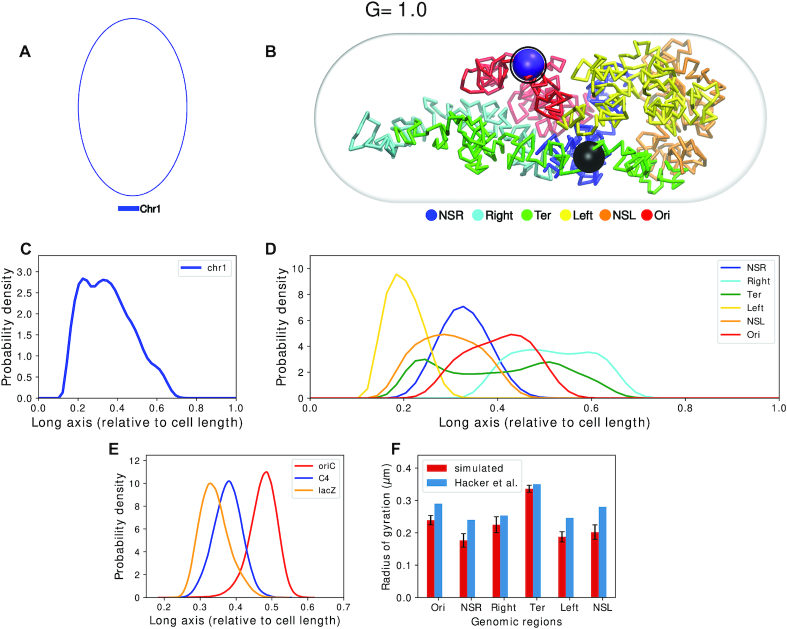
(A) Schematic for the chromosome topology for G = 1.0. (B) Snapshot of the equilibrated chromosome from a representative trajectory with macrodomains colored. OriCs have been colored in magenta and also have been encircled. Dif loci have been colored in black. (C) Linear density of chromosome along the long axis. (D) Average density of each macrodomain and non-structured regions, averaged over 200 trajectories and 2000 frames with respect to the cell’s long axis. (E) Distribution of position of three loci: oriC, C4 and lacZ along the long axis (Z-axis) as mentioned by Wiggins et al. (10). (F) Average radius of gyration of each macrodomain from current model as compared to that given by Hacker et al. (22) for oriC@midcell, plectonemic model.

