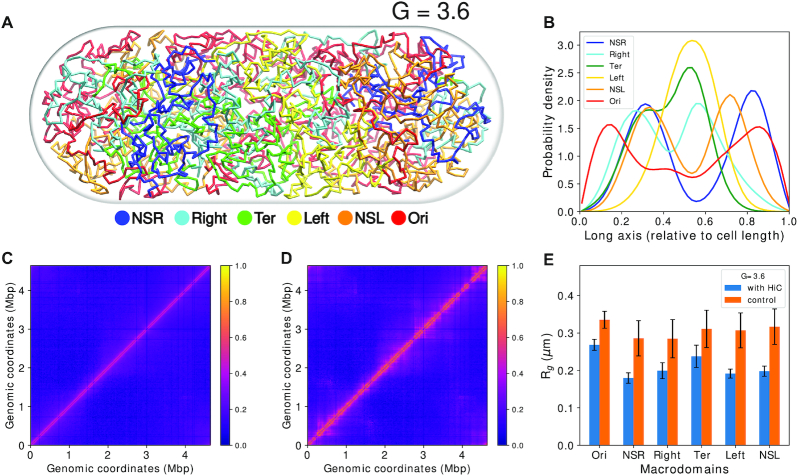
Figure 9.
(A) A color coded snapshot of the random-walk chromosome without Hi–C restraints (control). (B) Average densities of the four macrodomains and two non-structured regions with respect to the cell long axis. (C) Simulated contact probability matrix without Hi–C. (D) Simulated contact probability matrix with Hi–C. (E) Comparison of Rg of macrodomains between control and WT.

