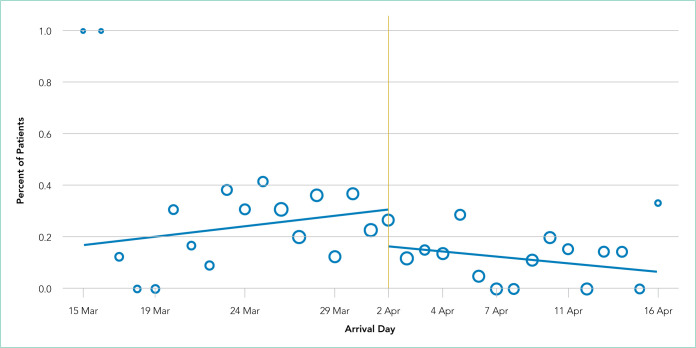
FIG.
Interrupted Time Series Analysis of Intubation Rates by Date of Arrival. Circle size represents relative number of patients seen each day. The slope of the preimplementation intubation rate increased about 2% per day (incidence rate ratio (IRR), 1.015; P = .54) whereas after the implementation of the noninvasive COVID-19 respiratory protocol, the slope decreased about 2% per day (IRR, 0.977; P = .56). Although there was a significant change in level after implementation, (IRR, 0.44; 95% CI, 0.23-0.83; P = .012), the slopes prior to and after the protocol implementation were not statistically different (P = .41).

