. 2020 Dec 25;37(4):481–484. doi: 10.5511/plantbiotechnology.20.0819a

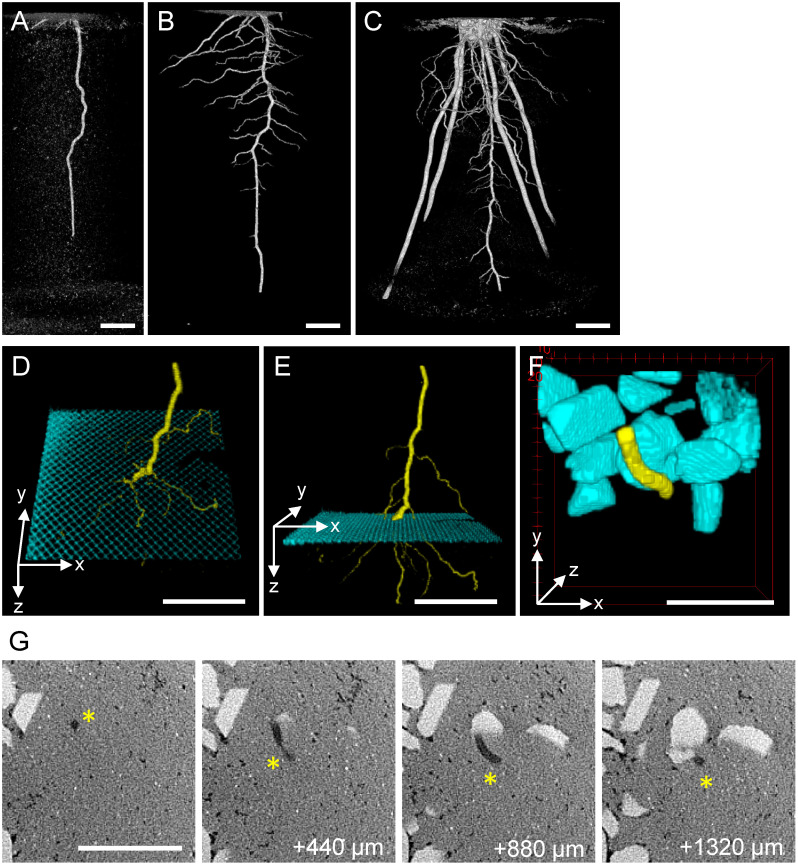
Figure 2. CT visualization of sorghum root growth in Toyoura sand. A–C: Time-course development of sorghum root system. A: 7 days after sowing. B: 14 days after sowing. C: 35 days after sowing. Panels A and B are from an identical plant. D–E: Passage of sorghum root (yellow) through metal mesh (cyan) buried in Toyoura sand, viewed from two angles. F: Detour growth of sorghum root (yellow) interfered by calcite gravels (cyan) mixed in Toyoura sand. G: Selected slices of the original CT data used to depict F. Four depth series (440 µm interval) of the same XY area, showing Toyoura sand as light-gray background, calcite gravels as whitish polygons, and root tissues as dark-gray filaments (asterisks). Scale bars: 1 cm.

Figure 2. CT visualization of sorghum root growth in Toyoura sand. A–C: Time-course development of sorghum root system. A: 7 days after sowing. B: 14 days after sowing. C: 35 days after sowing. Panels A and B are from an identical plant. D–E: Passage of sorghum root (yellow) through metal mesh (cyan) buried in Toyoura sand, viewed from two angles. F: Detour growth of sorghum root (yellow) interfered by calcite gravels (cyan) mixed in Toyoura sand. G: Selected slices of the original CT data used to depict F. Four depth series (440 µm interval) of the same XY area, showing Toyoura sand as light-gray background, calcite gravels as whitish polygons, and root tissues as dark-gray filaments (asterisks). Scale bars: 1 cm.