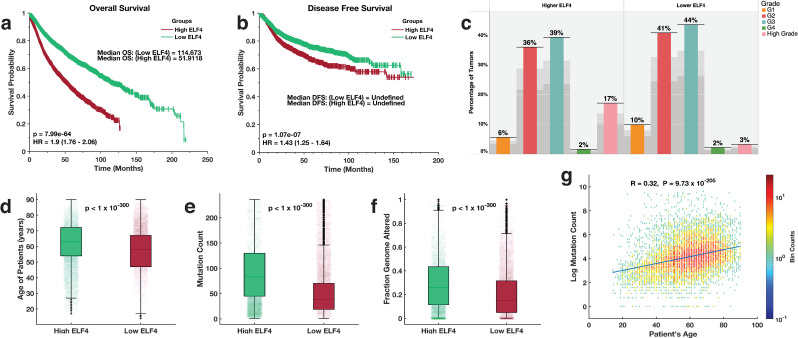
Fig 1.
Kaplan-Meier curve of the overall survival periods (a) and disease-free survival periods (b) of TCGA patients with tumours that expressed high ELF4 and low ELF4 transcript levels. (c) the distribution of various grades tumours derived from 32 human cancer that expressed high ELF4 and low ELF4 transcript levels. Median comparison of the (d) age of the patients (e) number of mutations per patients’ tumours (f) the fraction of the genome altered for each patient tumour between the ELF4-high tumours and ELF4-low tumours. (g) binned scatter plot showing the Pearson’s linear correlation between the age of the patients and the number of mutations in each patient’s tumours. The data points spaced into rectangular bins and each point is coloured based on logarithm bin size with redder colours indicating a higher number of plots. The colour bar shows the colour scale.

