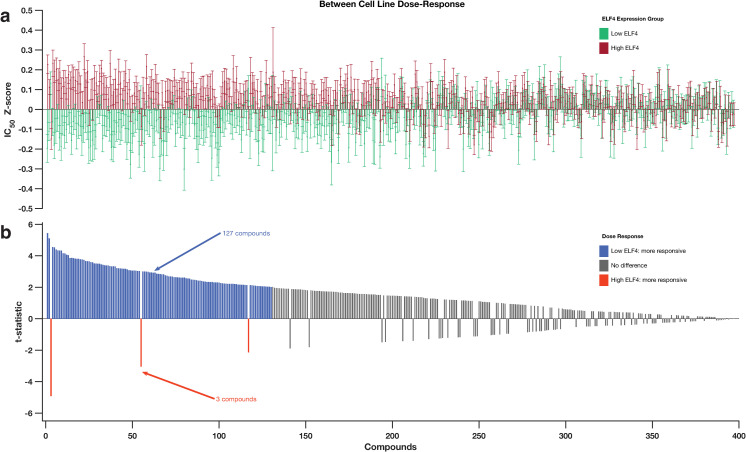
Fig 3.
(a) Comparison of the dose-response profiles between the GDSC cancer cell lines that express higher ELF4 and those that express lower ELF4 transcript. The bar graphs show the logarithm IC50 values of the cancer cell lines that correspond to those that express higher ELF4 (red bars) and express lower ELF4 (green bar). (b) bar graph shows the t-value calculated using the Welch test for each of the 397 anti-cancer drugs used to profile the dose-response of the cell lines by the GDSC. The drugs along the columns are matched to the columns in the top plots. The orange bars indicate the drug to which the high-ELF4 cell lines are significantly more responsive; the blue bars indicate drug to which the low-ELF4 cell lines are significantly more responsive. The grey bars show drugs for which we found a non-statistically significant difference in the responsive between the high-ELF4 cell lines and low-ELF4 cell lines. For details refer to S2 File.

