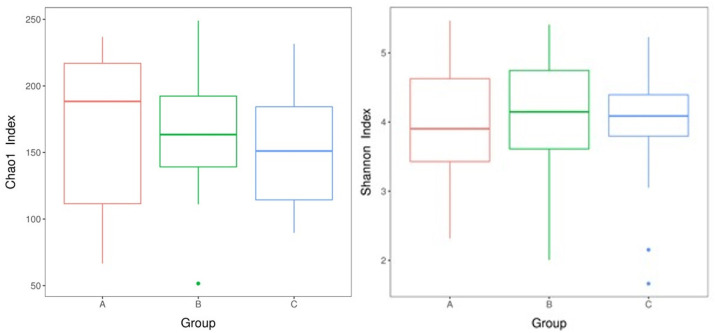
Fig 1. The alpha and beta diversity analyses among three COPD groups.
a: Chao1 index boxplot of each group. The X-axis indicates the names of the groups and Y-axis the Chao 1 index. Each box diagram shows the minimum, first quartile, medium, third quartile, and maximum values of the Chao1 index of the corresponding sample; b: Shannon index boxplot of each group; c: PCA score plot. A: stage 1, B: stage 2, C: stage 3+4.

