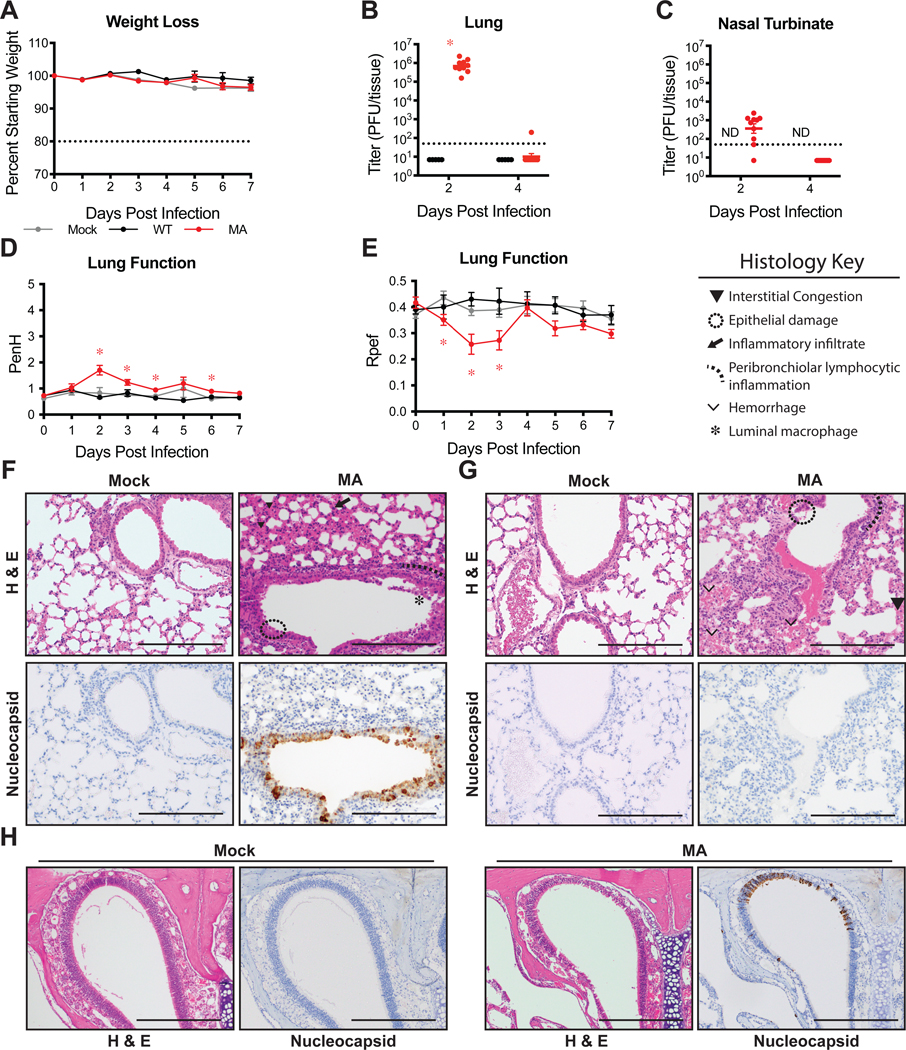
Figure 2: SARS-CoV-2 MA replicates in young BALB/c mice.

12-week-old female BALB/c mice were mock infected (gray), or infected with 105 PFU SARS-CoV-2 WT (black) or MA (red). Data combined from two independent experiments. (A) Percent starting weight. Dotted line represents weight loss criteria for humane euthanasia. Data analyzed by mixed effects analysis followed by Dunnett’s multiple comparisons. (B–C) Viral lung (B) and nasal turbinate (C) titer. 2dpi: n=5 WT, n=10 MA; 4dpi: n=5 WT, n=9 MA. Dotted line represents limit of detection (LOD). Undetected samples are plotted at half the LOD. Log transformed data analyzed by 2-way ANOVA followed by Sidak’s multiple comparisons. ‘ND’=not determined. (B) ‘*’ denotes p=<0.0001. (D–E) Whole body plethysmography assessing pulmonary function for PenH (D) and Rpef (E). Data analyzed by 2-way ANOVA followed by Dunnett’s multiple comparisons. Error bars represent standard error about the mean. (D) ‘*’ denotes p=0.012 (2dpi), 0.0025 (3dpi), 0.0030 (4dpi), 0.0018 (6dpi). (E) ‘*’ denotes p=0.0426 (1dpi), 0.0194 (2dpi), 0.0442 (3dpi) (F–H) 200X images of lung sections from 2dpi (F) and 4dpi (G) and 100X images of nasal turbinates from 2dpi (H). Top: hematoxylin and eosin (H&E). Bottom: immunohistochemistry staining (IHC) for SARS-CoV-2 nucleocapsid protein, counterstained with hematoxylin. Scale bars=200 μm. Representative of two independent experiments.
