
Figure 3. SARS-CoV-2 MA replicates in old BALB/c mice with minor disease.
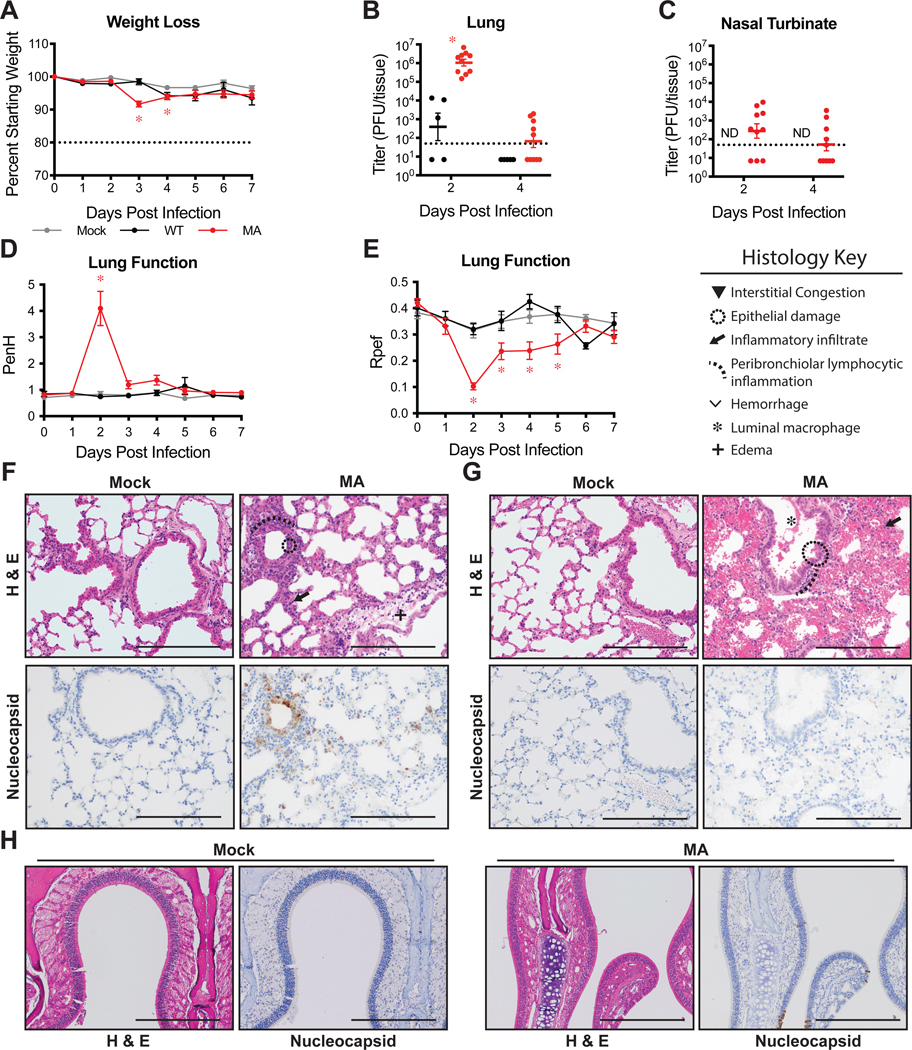
1-year-old female BALB/c were mock infected (gray), or infected with 105 PFU SARS-CoV-2 WT (black) or MA (red). Data combined from two independent experiments. (A) Percent starting weight. Dotted line represents weight loss criteria for humane euthanasia. Data analyzed by mixed effects analysis followed by Dunnett’s multiple comparisons. ‘*’ denotes p=<0.0001 (3dpi), 0.0305 (4dpi). (B–C) Viral lung (B) and nasal turbinate (C) titer. 2dpi & 4dpi: n=5 WT, n=10 MA. Dotted line represents limit of detection (LOD). Undetected samples are plotted at half the LOD. Log transformed data analyzed by 2-way ANOVA followed by Sidak’s multiple comparisons. ‘ND’=not determined (B) ‘*’ denotes p=<0.0001. (D–E) Whole body plethysmography assessing pulmonary function for PenH (D) and Rpef (E). Data analyzed by 2-way ANOVA followed by Dunnett’s multiple comparisons. Error bars represent standard error about the mean. (D) ‘*’ denotes p=0.0014 (2dpi). (E) ‘*’ denotes p=<0.0001 (2dpi), 0.0242 (3dpi), 0.0130 (4dpi), 0.0481 (5dpi). (F–H) 200X images of lung sections from 2dpi (F) and 4dpi (G) and 100X images of nasal turbinates from 2dpi (H). Top: hematoxylin and eosin (H&E). Bottom: immunohistochemistry staining (IHC) for SARS-CoV-2 nucleocapsid protein, counterstained with hematoxylin. Scale bars=200 μm. Representative of two independent experiments.