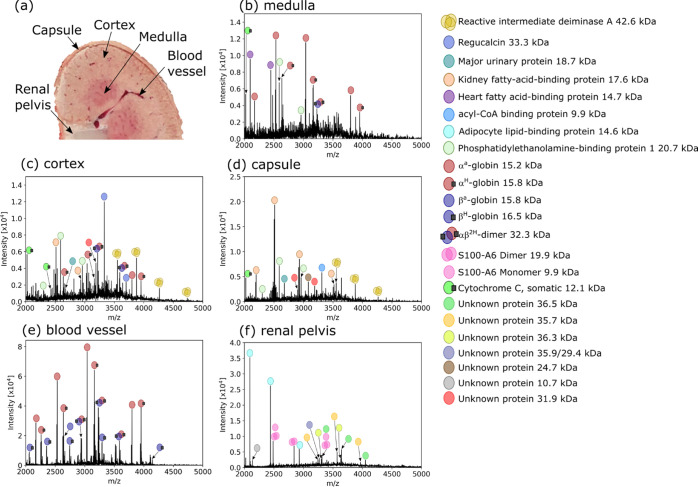
Figure 1.
(a) Photograph of the rat kidney during sectioning with labeled regions corresponding to the following mass spectra. (b–f) Native mass spectra from distinct regions of the kidney. Some proteins exhibited strong signals in one region, e.g., H-FABP in the medulla (b), regucalcin in the cortex (c), and adipocyte lipid-binding protein in the renal pelvis (f). Spectra are the result of averaging multiple orbitrap scans ((b): 48, ∼0.096 mm2 of tissue sampled, (c): 148, ∼0.3 mm2, (d): 18, ∼0.036 mm2, (e): 22, ∼0.044 mm2, (f): 188, ∼0.376 mm2) from raster line scans acquired at 20 μm/s in the respective region of tissue to improve the signal-to-noise ratio.

