
Figure 3.
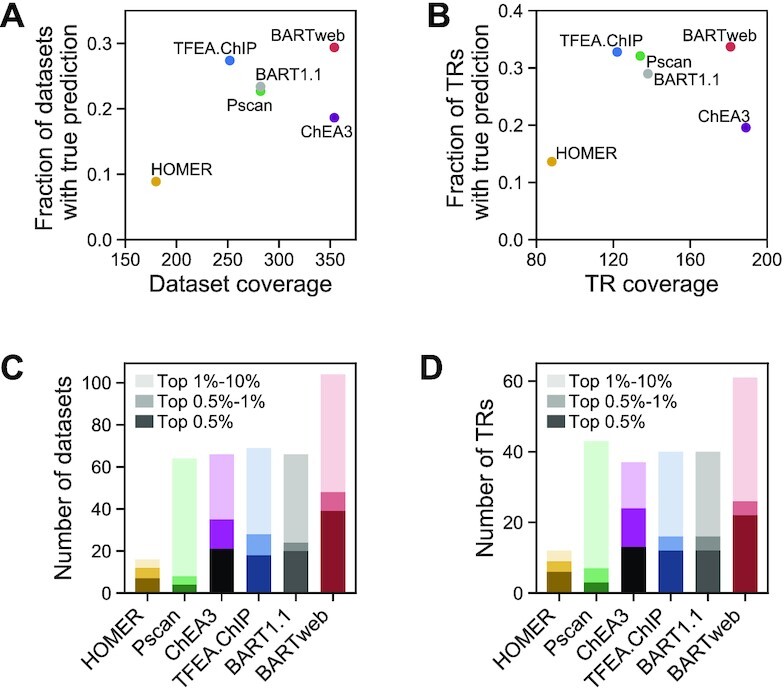
Performance comparison of BARTweb with five other tools on knockTF datasets. (A) Performance of each tool reflected by the fraction of knockTF datasets with true prediction (y-axis) against the number of knockTF datasets whose KD/KO TR were included in the tool (x-axis). (B) Performance of each tool reflected by the fraction of unique KD/KO TRs with true prediction (y-axis) against the number of unique KD/KO TRs included in the tool (x-axis). (C) Number of knockTF datasets with true prediction under different rank cutoffs for each tool. (D) Number of unique KD/KO TRs with true prediction under different rank cutoffs for each tool.