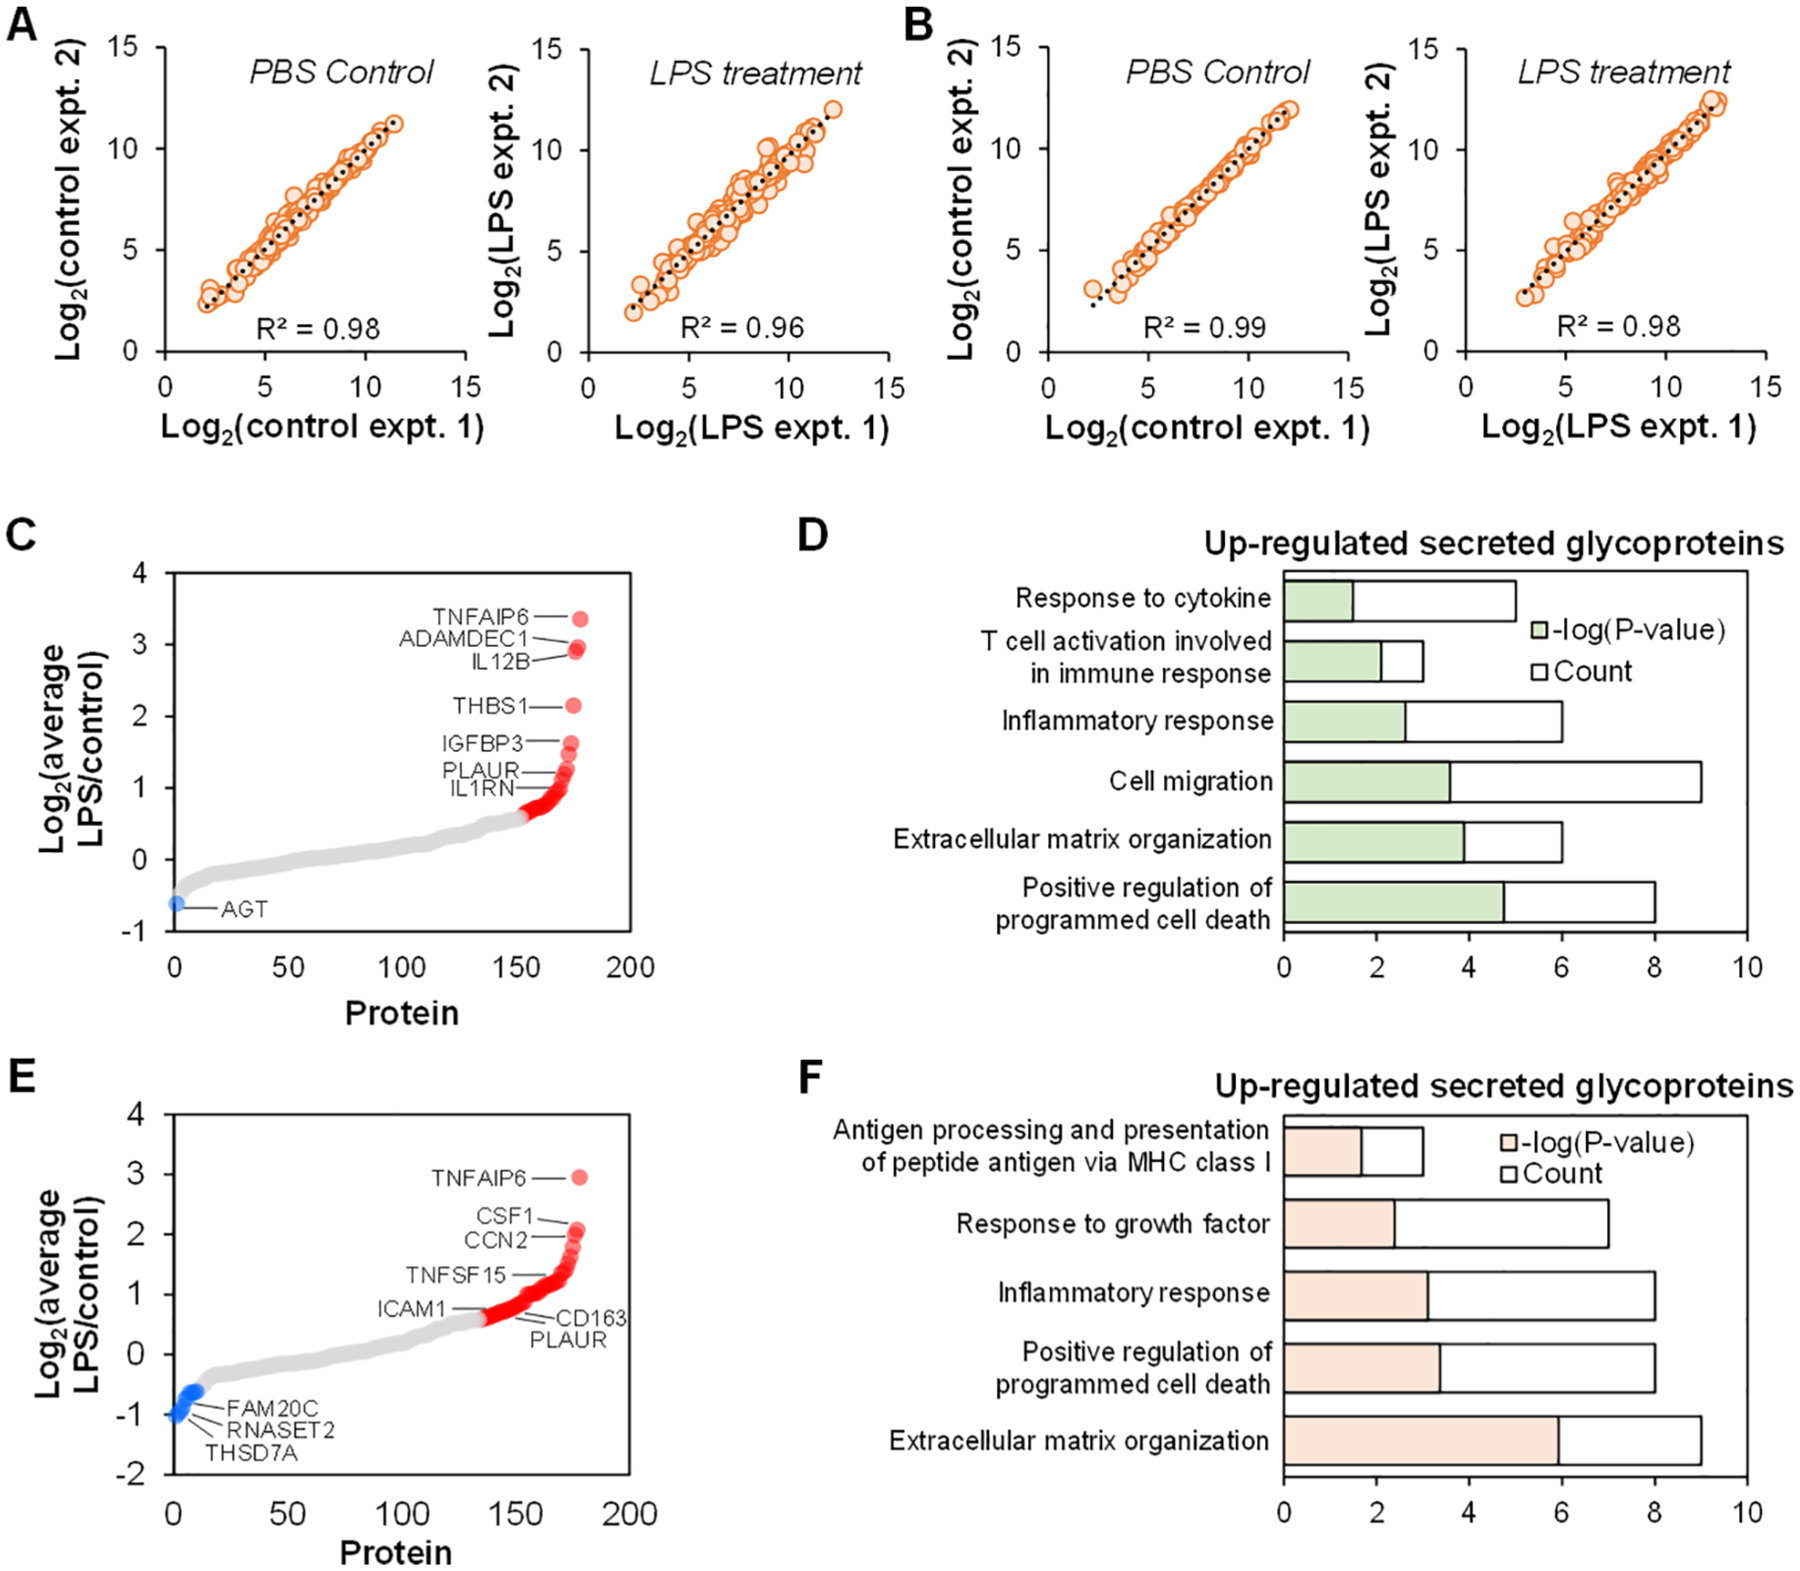
Figure 6.

Quantification of secreted glycoproteins from THP-1 monocytes and M0 macrophages treated with LPS. (A-B) Correlation of deglycosylated peptides (A) and glycoproteins (B) quantified from THP-1 monocytes. (C) The abundance changes of secreted glycoproteins from THP-1 monocytes stimulated with LPS. The cutoff for up-or down-regulation is the fold change of 1.5. (D) GO clustering of up-regulated secreted glycoproteins from THP-1 monocytes after the LPS treatment based on biological process. (E) The abundance changes of secreted glycoproteins from M0 macrophages stimulated with LPS. (F) GO clustering of up-regulated secreted glycoproteins from M0 macrophages after the LPS treatment based on biological process.
