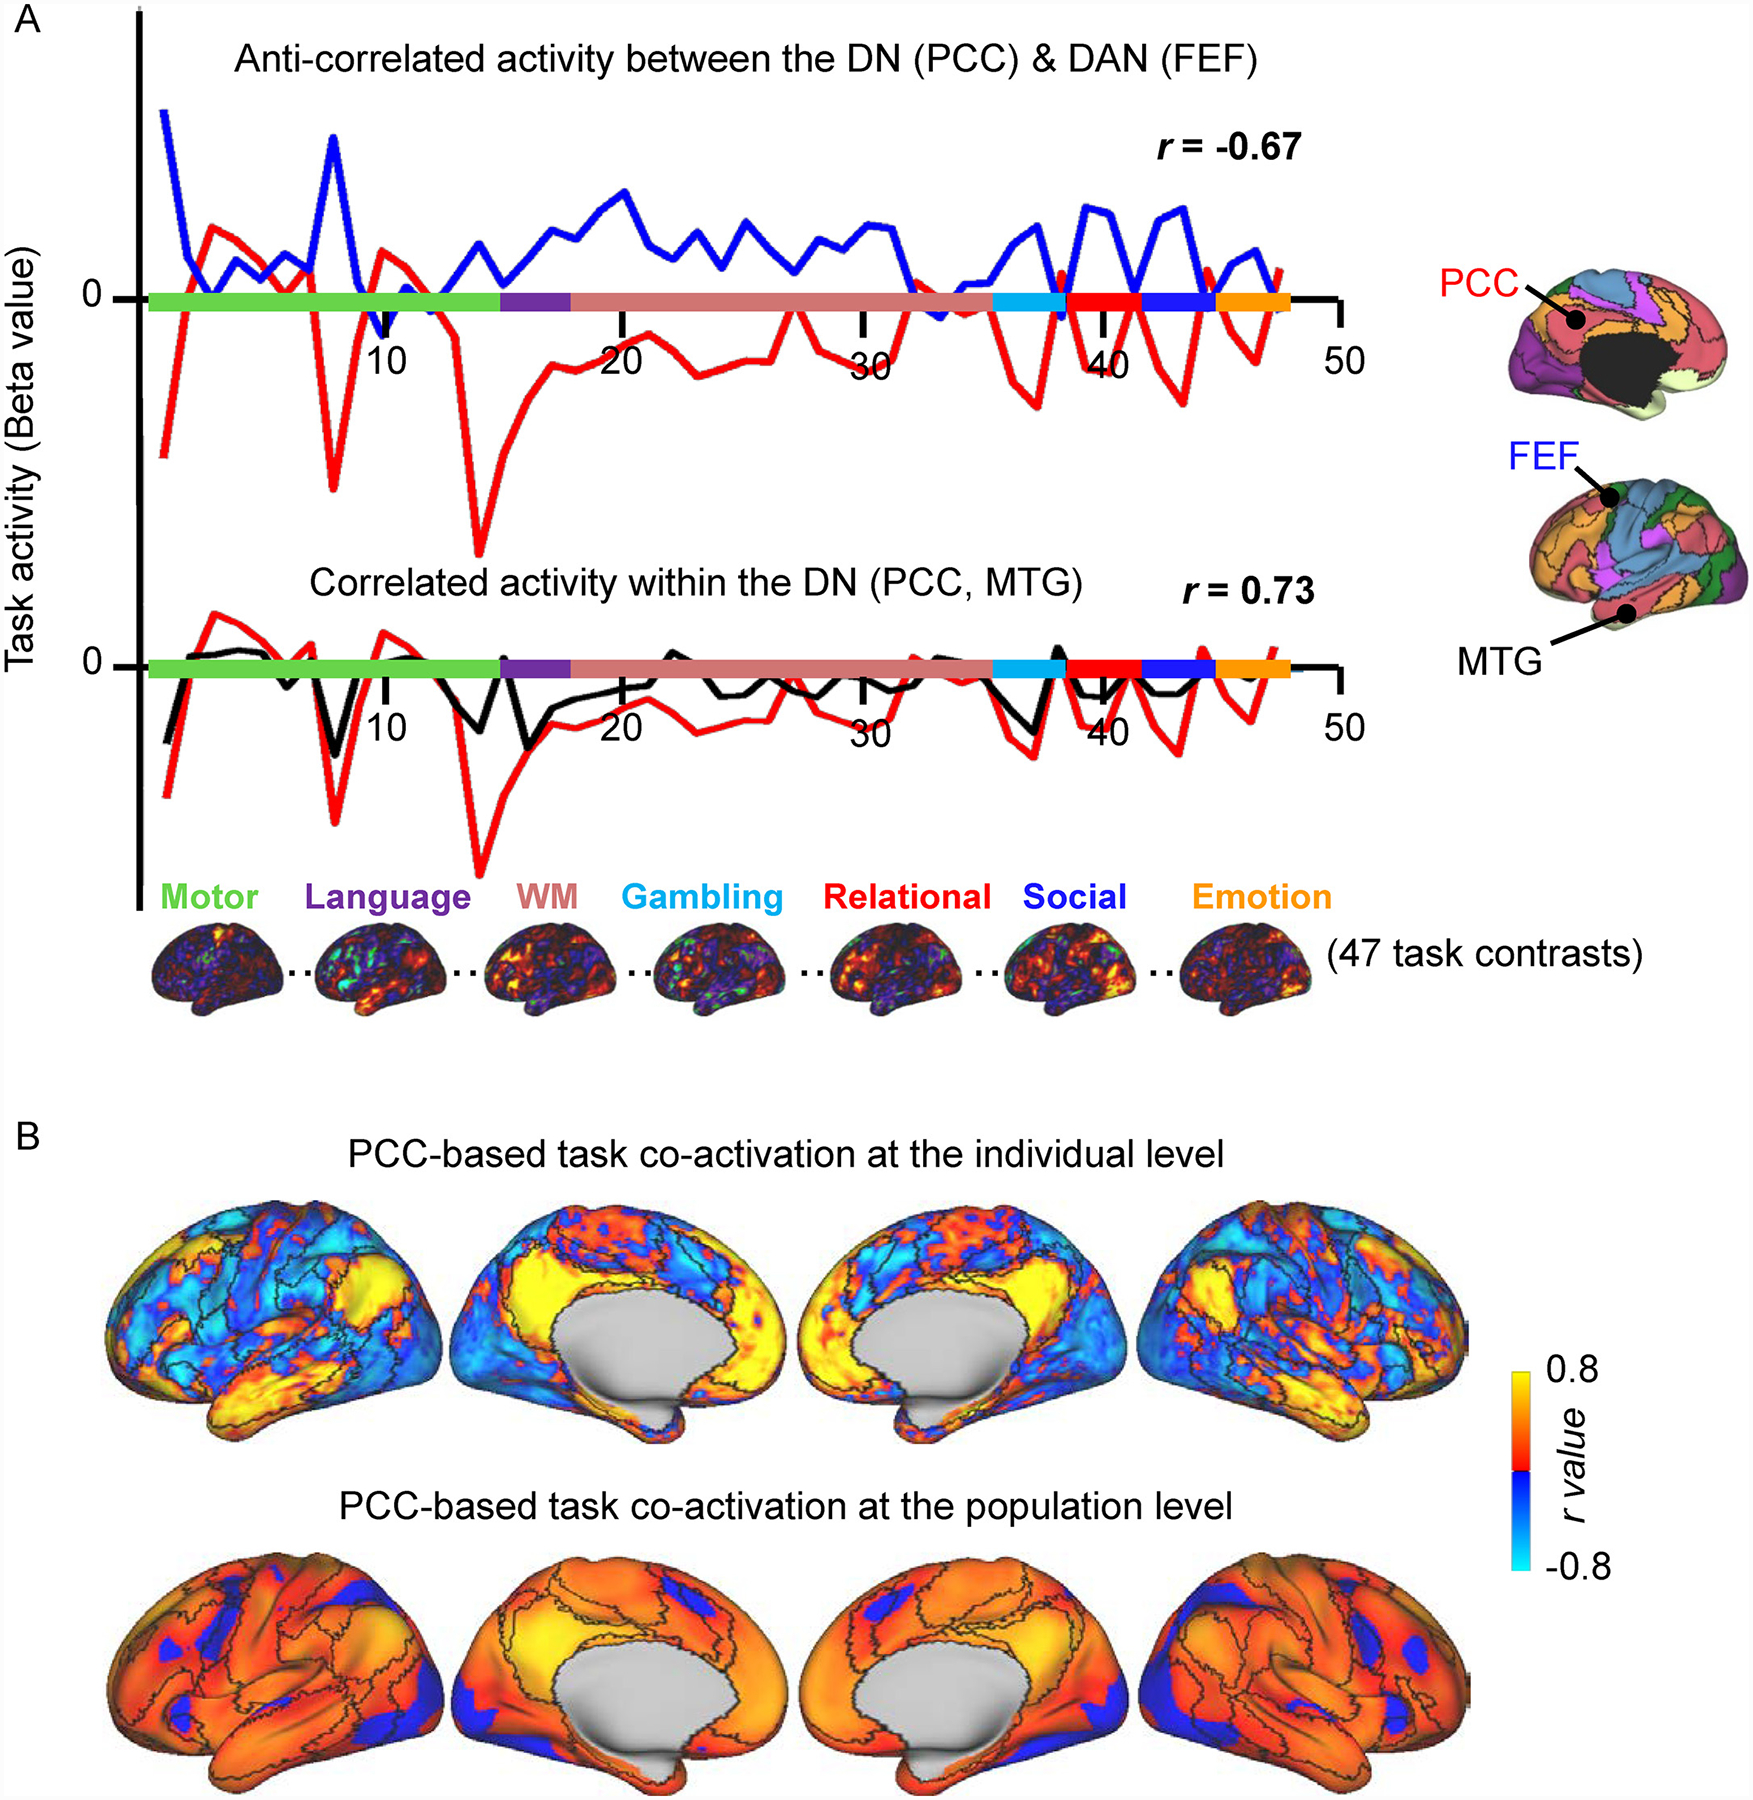
Fig. 1. Anti-correlations are present during task performance.

(A) Forty-seven task activation beta values across a set of task contrasts are shown for two seeds from the DN, PCC (red line) and MTG (black line), and one seed from the DAN, FEF (blue line) in one HCP participant (“748258″). The PCC shows anti-correlated activity (r = −0.67) with the DAN seed (FEF) and positively correlated activity (r = 0.73) with a seed (MTG) in its own network (DN). Seven activation maps from different cognitive domains projected onto the cortical surface are shown. The colors on the x axis indicate the contrasts belonging to each task. (B)Task co-activation map for a seed region in the PCC at the individual level (top) and at the population level (bottom). The task co-activation maps exhibit connections that are consistently positive and others that are consistently anti-correlated. Concordant with resting-state functional connectivity, the task-based co-activation map of the PCC shows positive correlations with other default network regions such as the MTG, and anti-correlations with DAN areas such as the FEF. The color scale illustrates Pearson r coefficients, with warm colors indicating positive correlations and cool colors indicating negative correlations. The black outlines indicate network boundaries based on the parcellation detailed in Yeo et al. (2011).
DAN, dorsal attention network; DN, default network; FEF, frontal eye field; MTG, middle temporal gyrus; PCC, posterior cingulate cortex.
