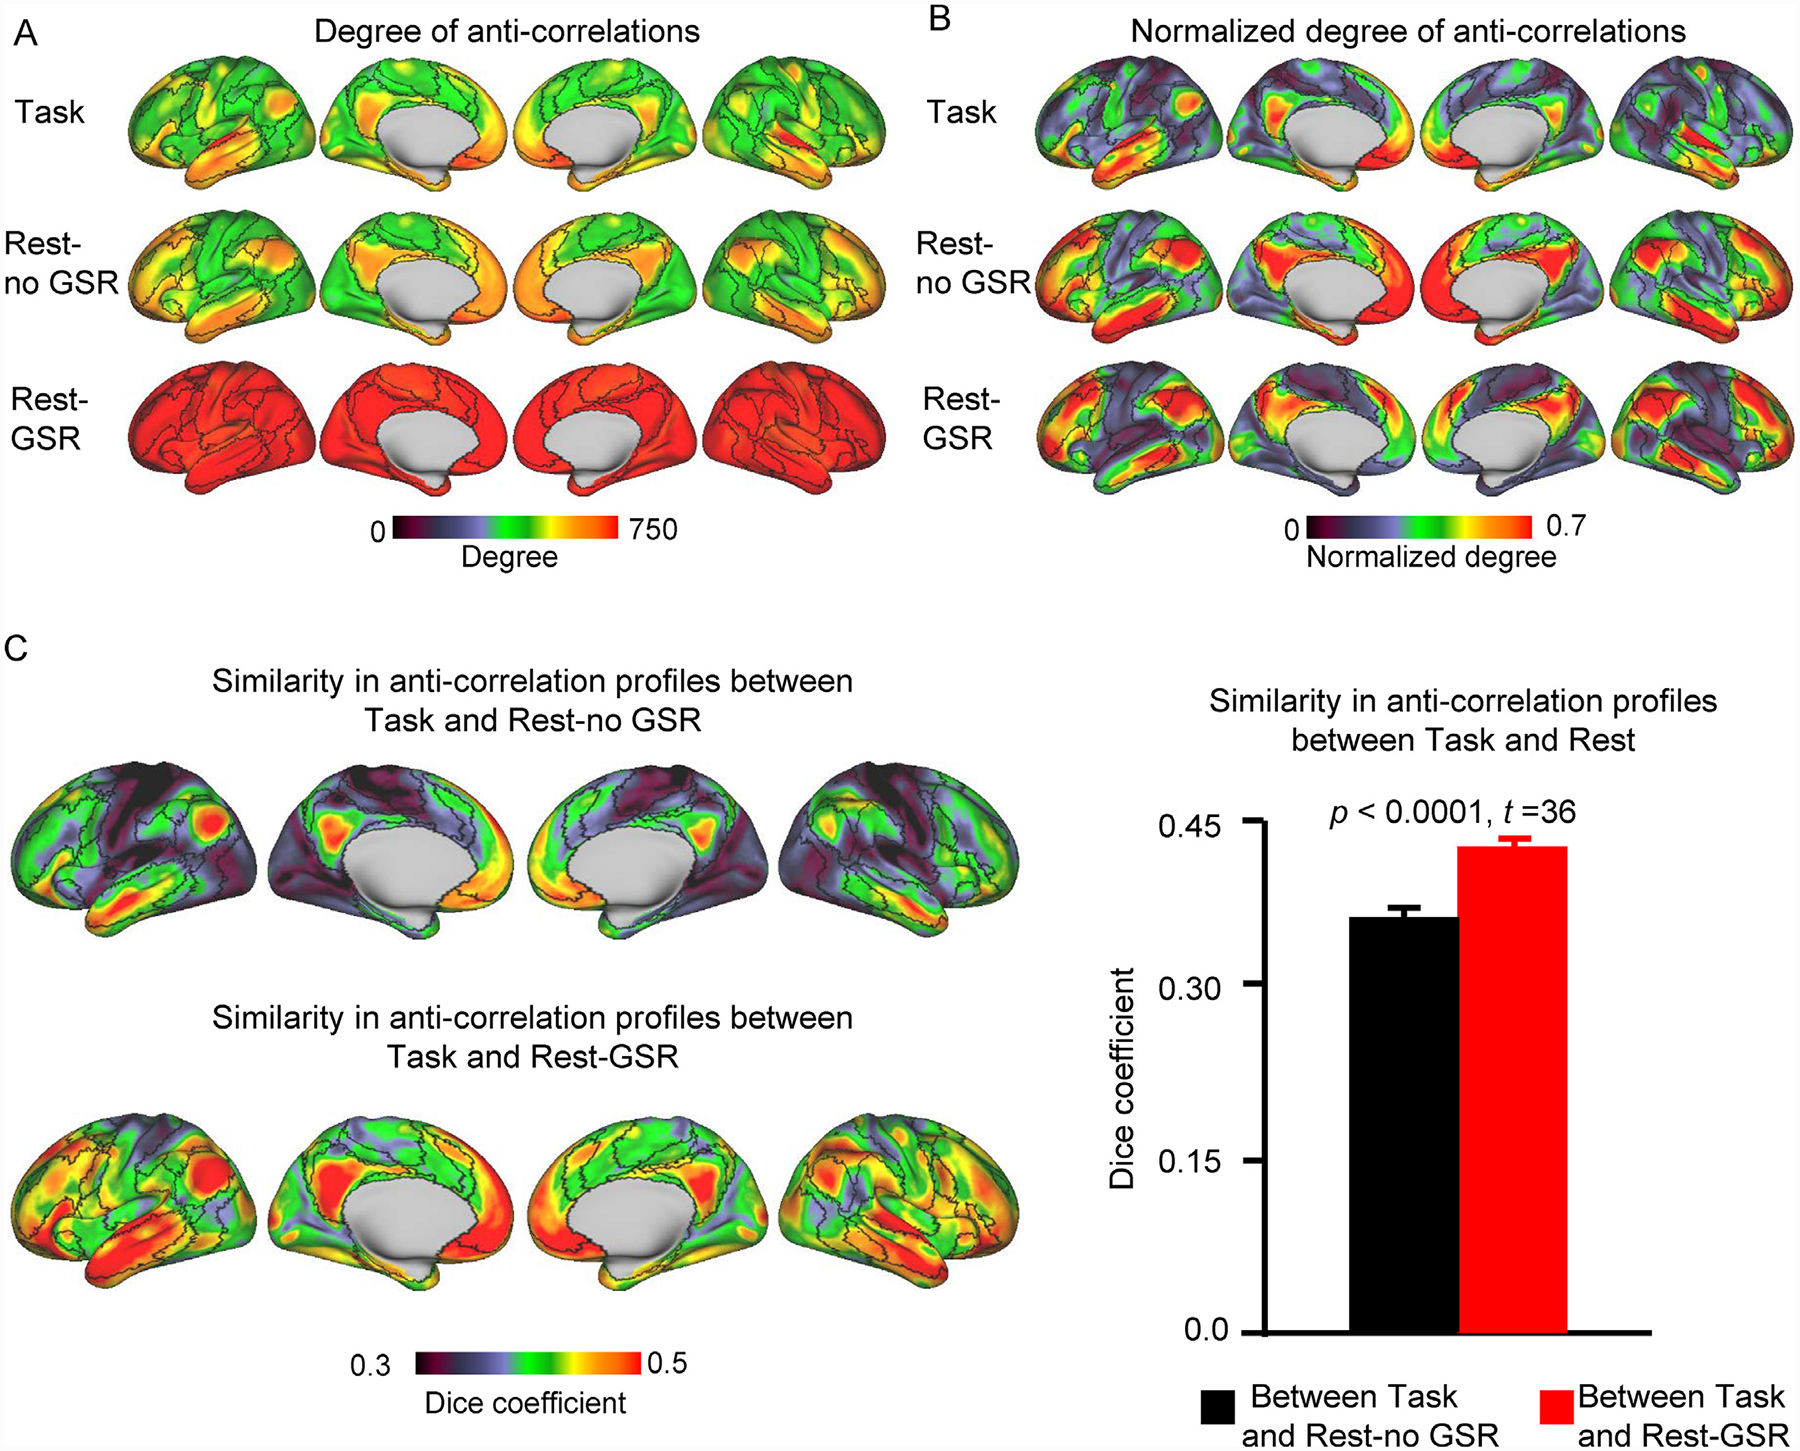
Fig. 3. Default network areas exhibit many anti-correlations across task and resting-state conditions.

(A) The degree of anti-correlations was mapped for every vertex on the cortical surface. It was calculated as the number of anti-correlations between a given vertex and all other 1483 vertices on the cortical surface. Maps were obtained and averaged across all 680 HCP participants. Vertices in the Rest-GSR condition show the strongest degrees of anti-correlations, followed by the Rest-no GSR condition, while the Task condition had the lowest degrees of anti-correlations. The color scale indicates the degree (number) of anti-correlations. (B) To facilite the visualization of the distribution of anti-correlations across the cortical surface, we generated maps of the normalized degree of anti-correlations for each condition. Regardless of the condition (Task, Rest-no GSR, Rest-GSR), default network and limbic network areas exhibit a higher degree of anti-correlations with the rest of the cortical surface. (C) Similarity in the anti-correlation profiles between the Task and Rest-no GSR conditions (left, top row) and between the Task and Rest-GSR conditions (left, bottom row). Similarity was quantified at each vertex by calculating the Dice overlap coefficient between task-based and resting-state anti-correlation profiles for each participant, and averaged across participants thereafter. The color scale indicates the Dice coefficient. Overall, when considering all vertices together (right), GSR-preprocessed resting-state data shows a higher similarity to task data than does resting-state data not processed with GSR (paired t-test: t(679) = 36, p < 0.0001). Error bars represent standard errors.
