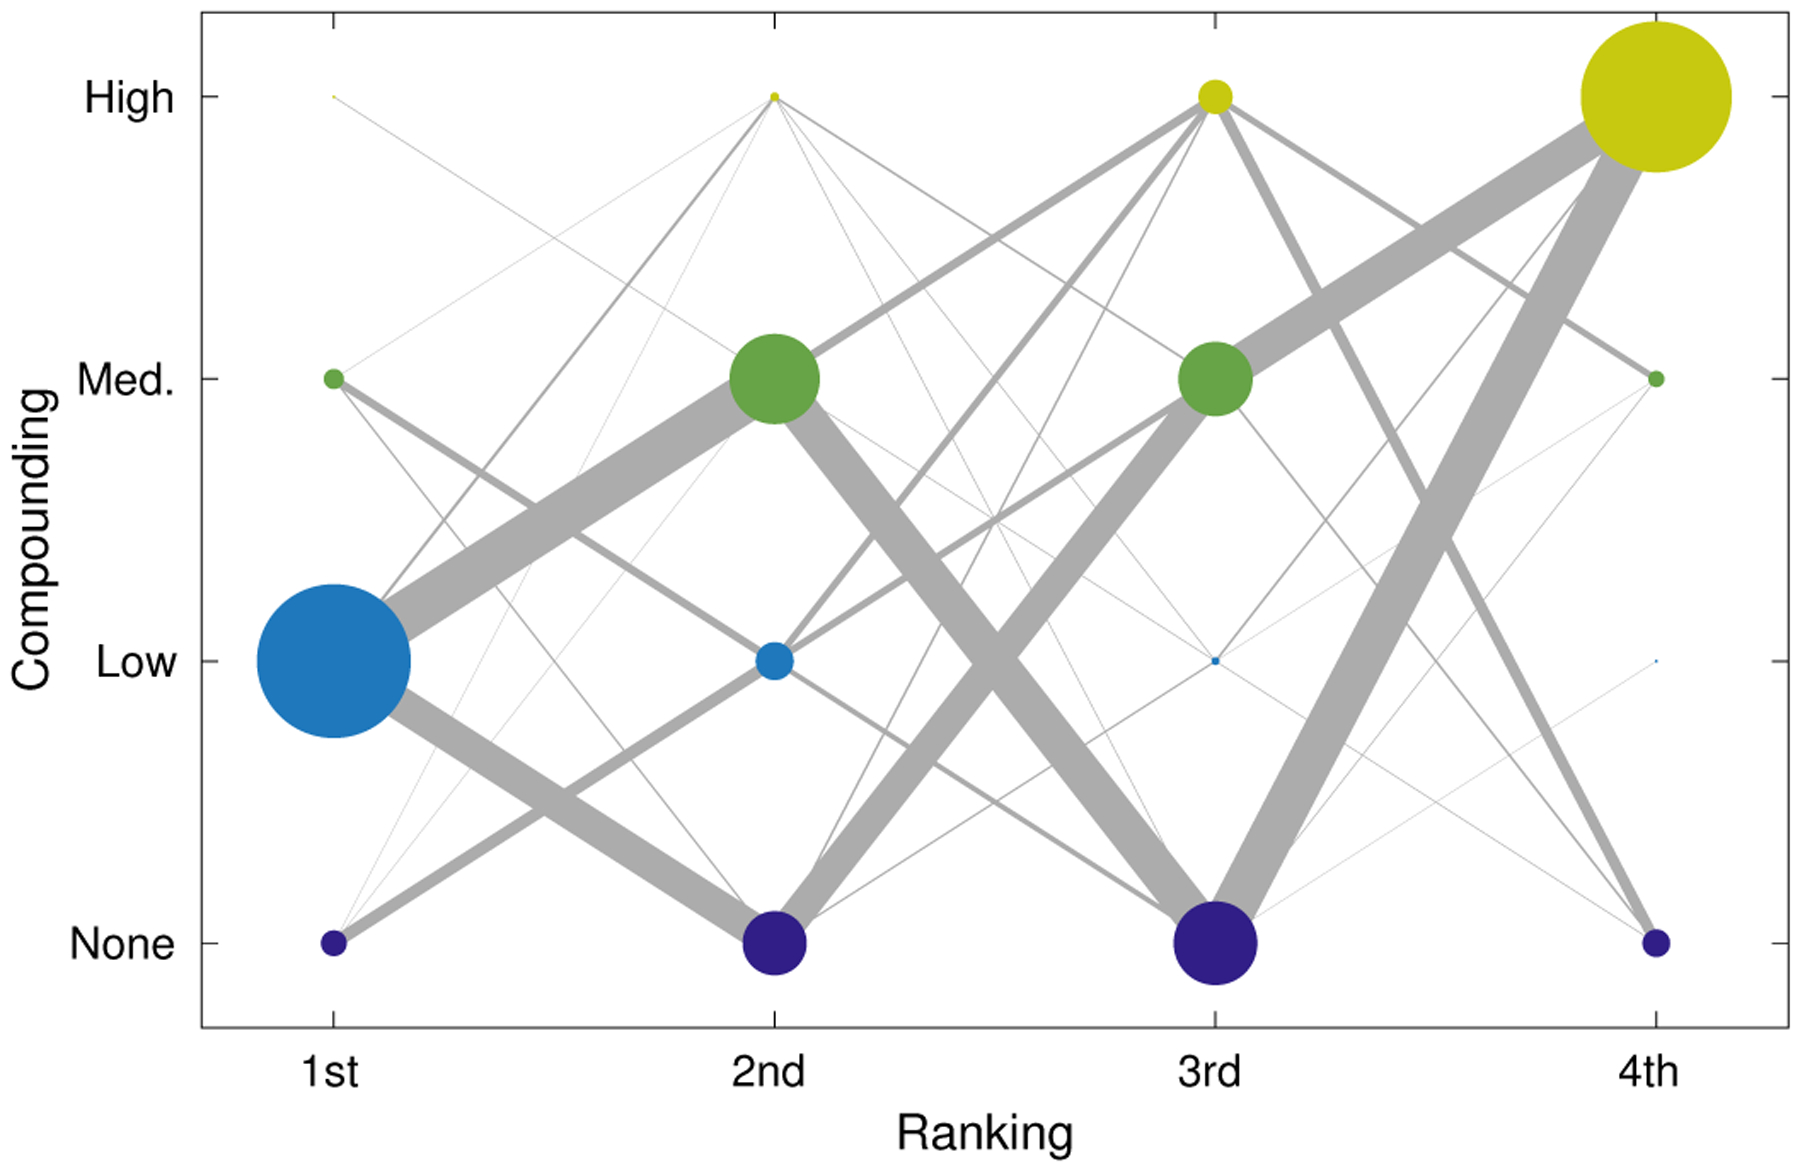
Fig. 10.

Weighted graph showing ordering of preferences across all tasks and reviewers. Marker size indicates relative frequency of a ranking for a particular compounding condition and matches the counts provided in Table II. Edges between markers represent a sequential ranking of two compounding conditions and the thickness of the line indicates relative frequency of the ordering. For example, reviewers most commonly selected “Low” first and approximately equally selected “Medium” and “None” second.
