
Figure 5.
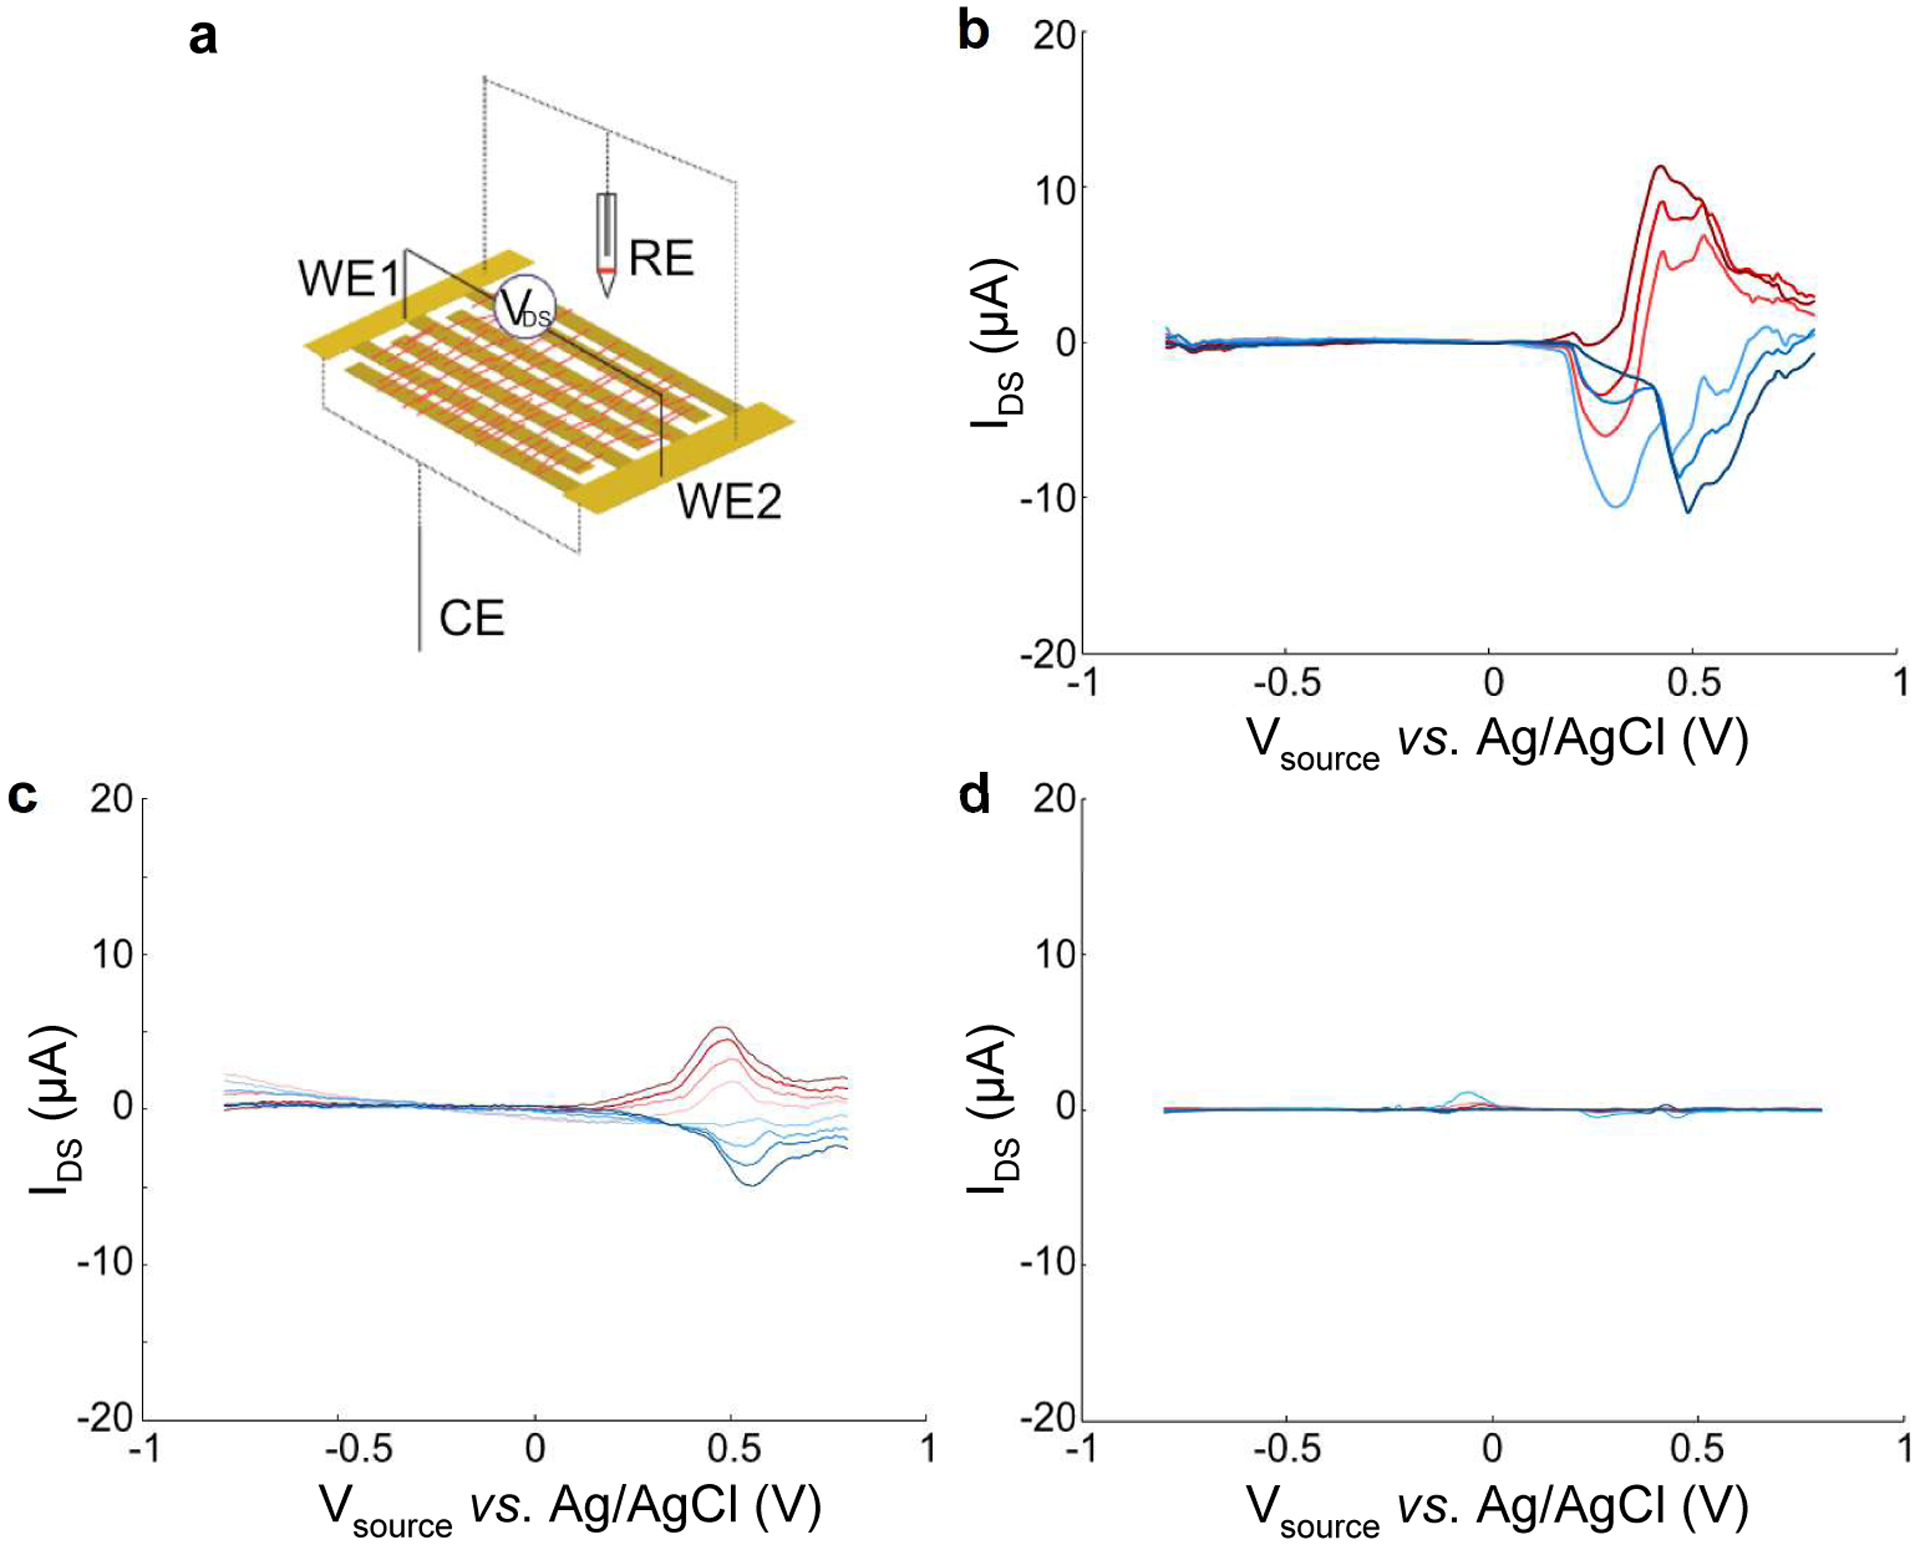
Bipotentiostat cyclic voltammogram measurements of nanowires and controls. a) Device schematic demonstrating nanowires deposited across electrodes (working electrode 1 & 2, WE1 & WE2; reference electrode, RE; counter electrode, CE). WE1 and WE2 are the “source” and “drain” electrodes, respectively. b) γPFD-cytc3 nanowire, c) cytc3-SpyCatcher, d) γPFD-SpyTag. All measurements performed at a scan rate of 50 mV/s in 0.1 M phosphate buffer, pH 8.4.