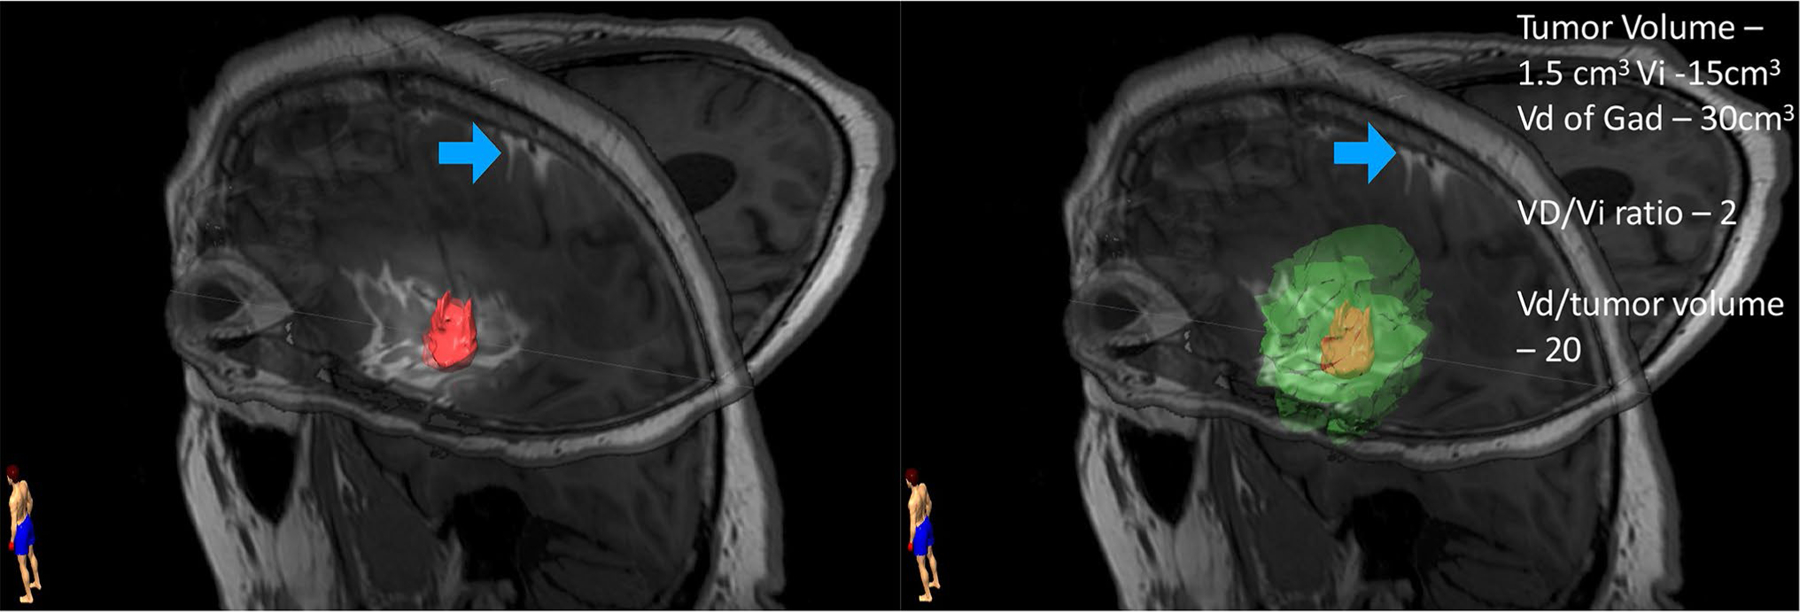
Fig. 2.

T1-weighted non-enhanced image demonstrating intratumoral infusion of chemotherapy with gadolinium tracer. The tumor volume has been segmented out and highlighted in pink. The gadolinium tracer correlating to the volume of distribution of infusate is segmented and highlighted in green. Analysis of the Vd demonstrates an irregular shaped Vd conforming to structural restrictions to flow such as pial boundaries. Infusing 15cm3 of drug resulted in a Vd of 30cm3 with an associated Vd/Vi ratio of 2. In this case, the Vd/tumor volume ratio is 20. Interestingly, a large Vd was achievable despite evidence of back flow into the subarachnoid space (blue arrow)
