
Figure 4. Mutation of dxo1 causes upregulation of defense-related genes and downregulation of photosynthesis-related genes.
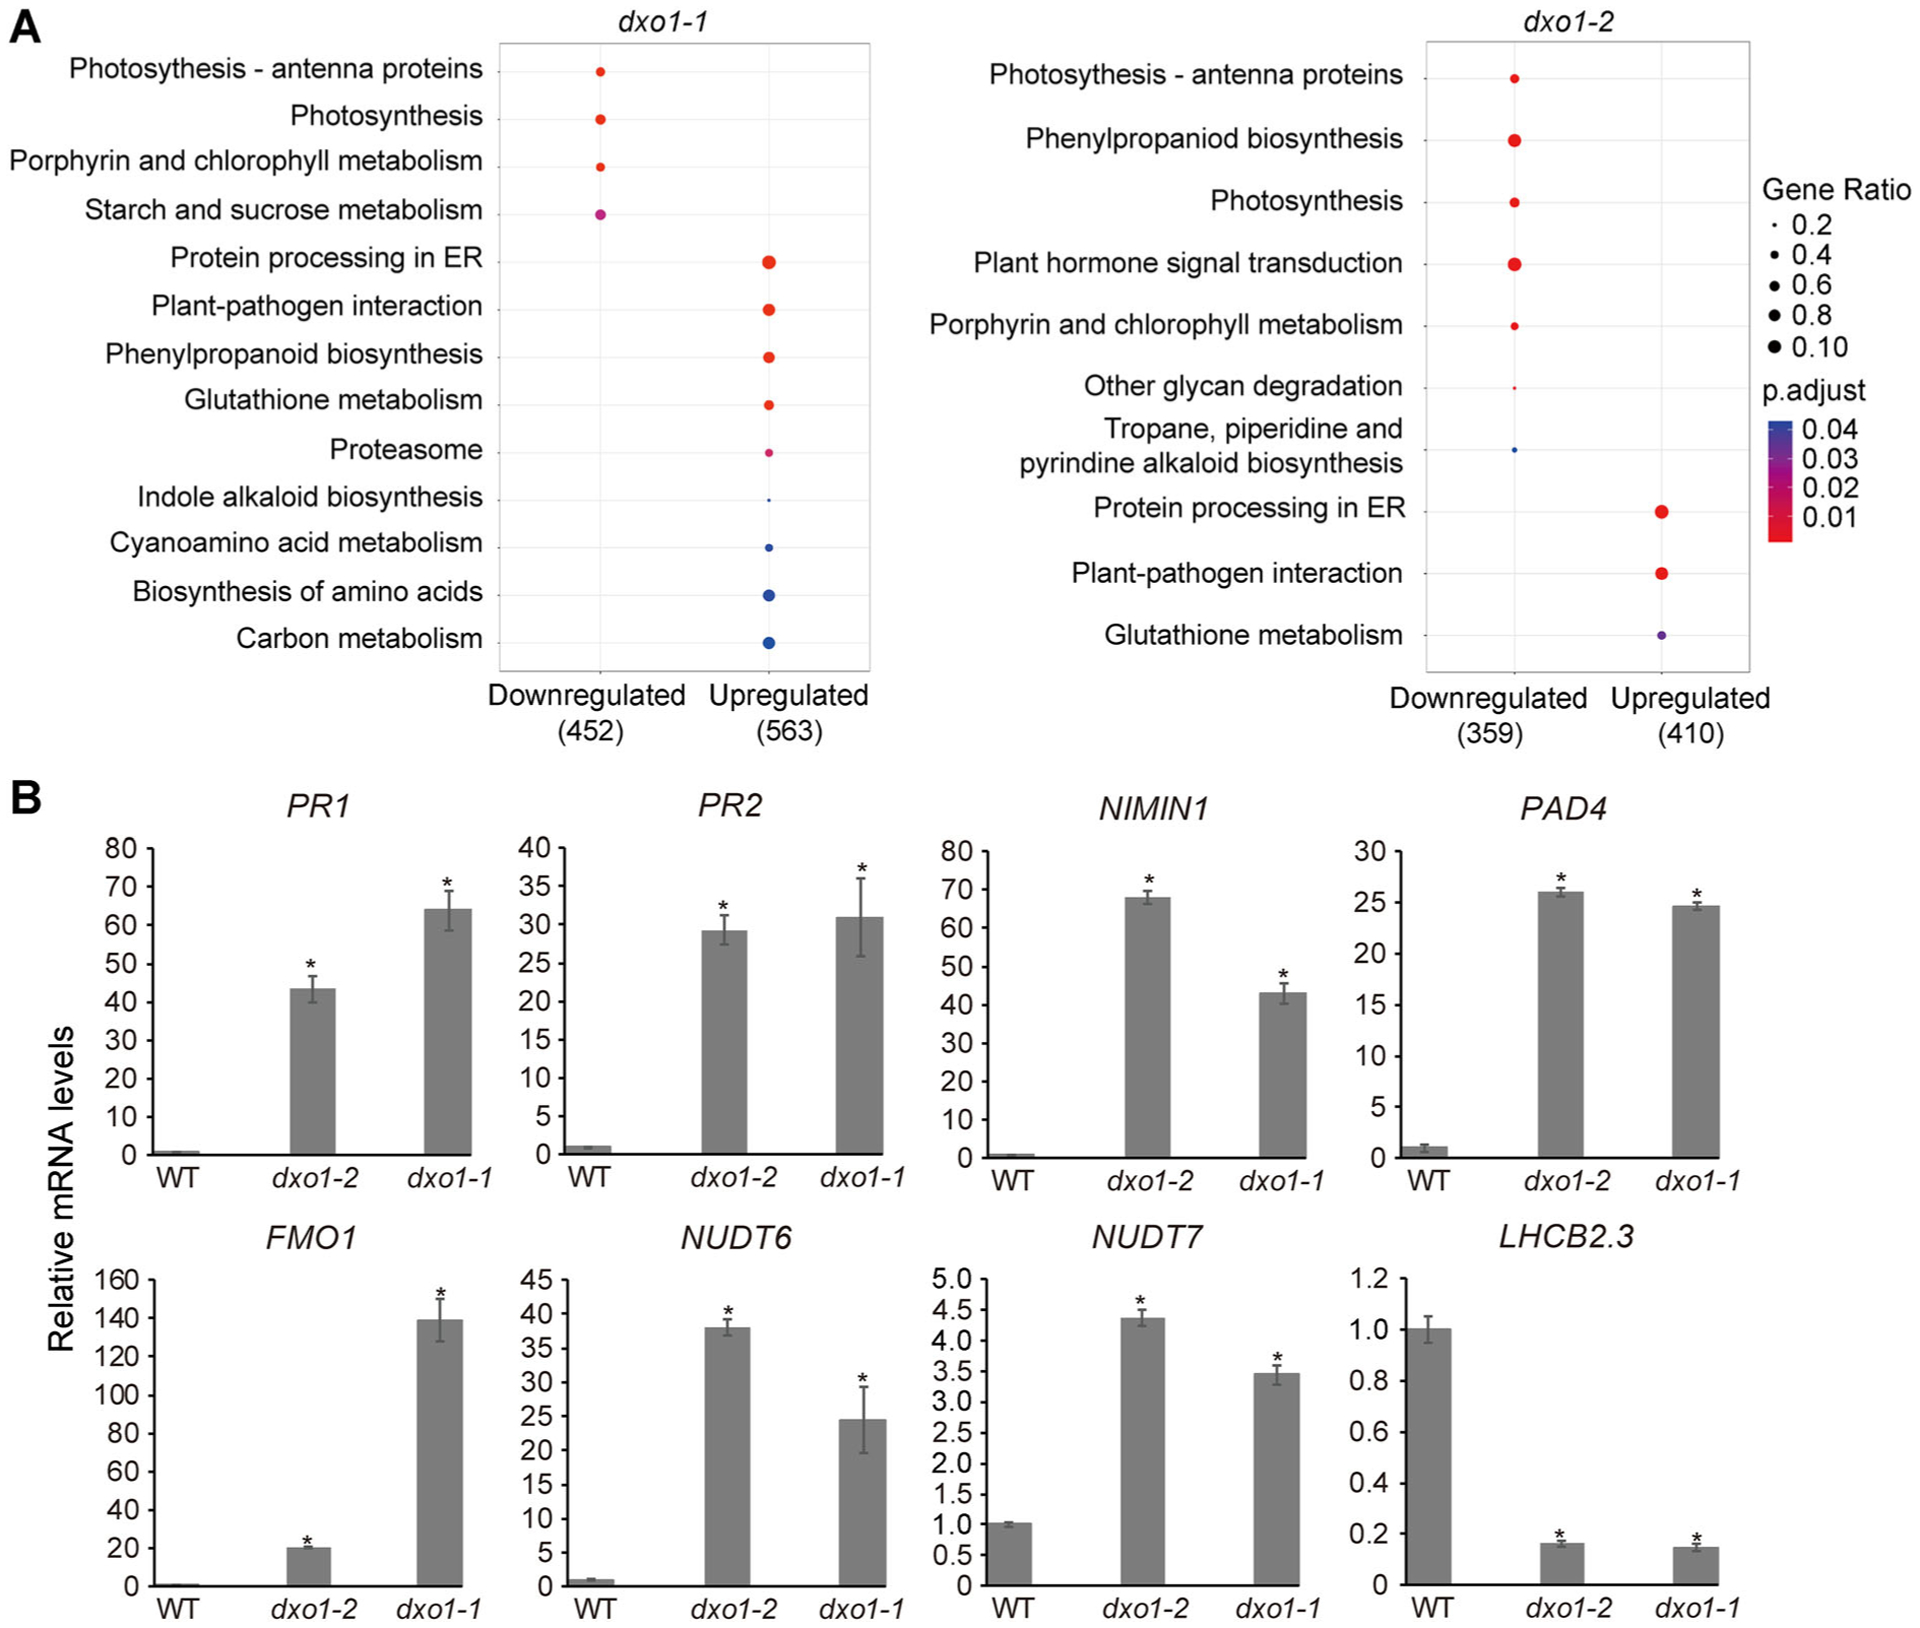
(A) KEGG pathway enrichment analysis of DEGs between the dxo1 mutants and WT. The dot size represents gene ratio (number of enriched genes/number of DEGs), and the color of the dots represents the P-value from high (blue) to low (red). (B) Expression levels of 10 DEGs in WT, dxo1-1 and dxo1-2 determined by qPCR. RNA was extracted from 16-d-old rosette leaves. Error bars represent standard deviation; a t-test was used for statistical significance analysis. *Indicates statistically significant (P < 0.05).