
Figure 6. Interactions between dxo1-2 and the PTGS pathway and ct-siRNA profiles of various mutants.
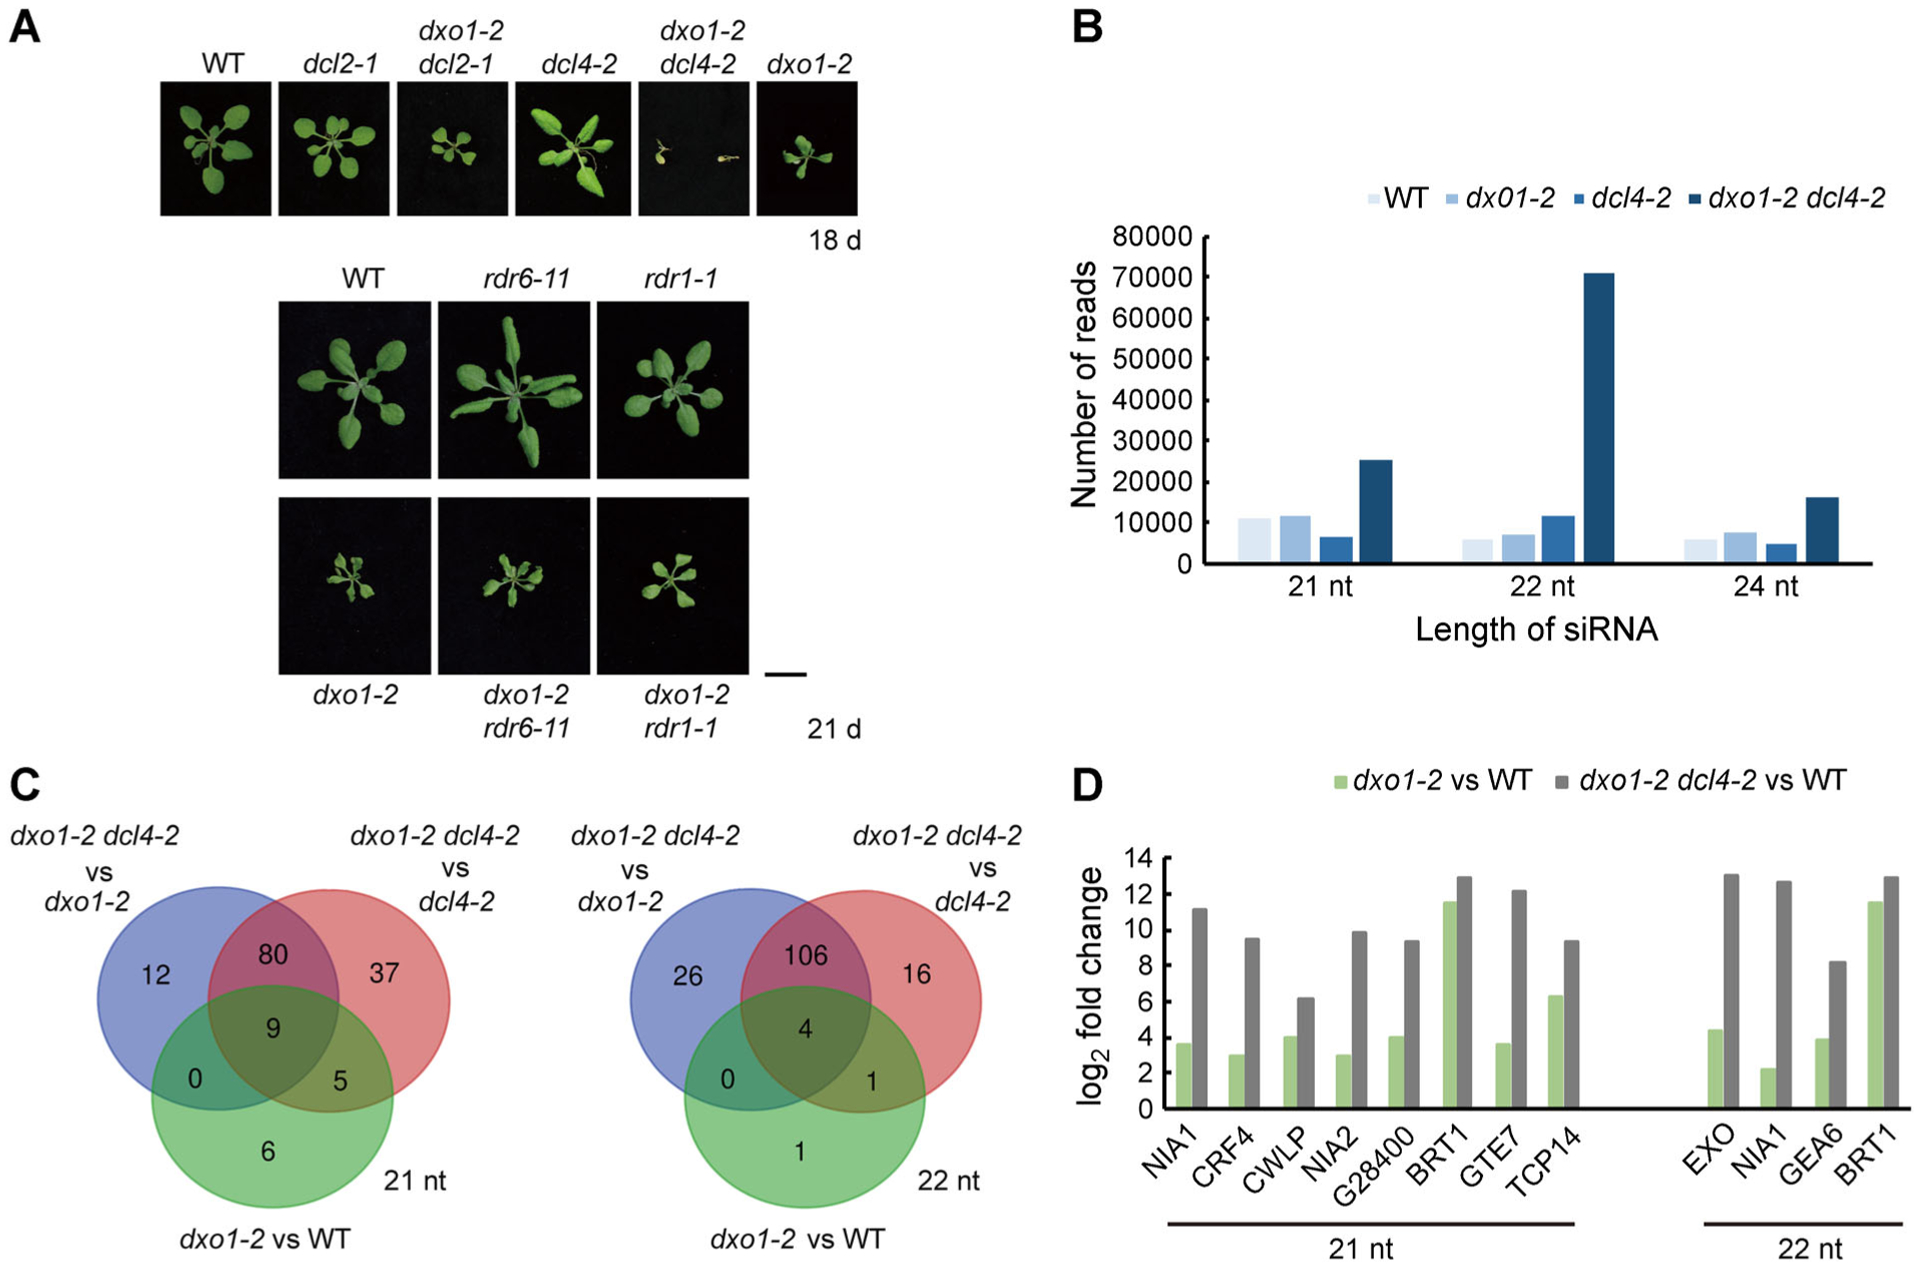
(A) Phenotypes of WT, dxo1-2, and the various double mutants between dxo1-2 and four mutants in the PTGS pathway. Bar: 1 cm. (B) Abundance of different sizes of ct-siRNAs in the different genotypes. Read counts were obtained from sRNA-seq of 10-d-old WT, dxo1-2, and dxo1-2 dcl4-2 plants and were normalized to reads per million. (C) Venn diagram of the number of genes with significant increases in the abundance of 21-nt or 22-nt ct-siRNAs in comparisons between dxo1-2 dcl4-2 and dxo1-2, between dxo1-2 dcl4-2 and dcl4-2, and between dxo1-2 and WT. Genes were selected if the ct-siRNA abundance differed by 2-fold or more with an FDR-adjusted P-value ≤ 0.01. (D) Log2 fold changes of 21- or 22-nt ct-siRNAs of the genes between dxo1-2and WTand dxo1-2 dcl4-2and WT.