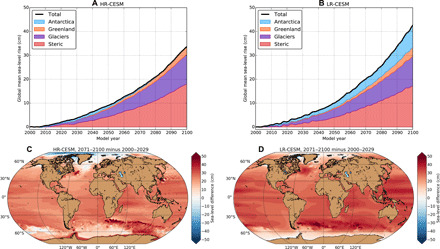
Fig. 1. Contributions to GMSLR.

(A and B) Contributions to global mean sea-level rise over the 101-year period for the HR-CESM and LR-CESM, respectively; the black curve indicates the total global mean sea-level rise. (C and D) The local sea-level difference between the time mean over years 2071–2100 and time mean over years 2000–2029 for the HR-CESM and LR-CESM, respectively.
