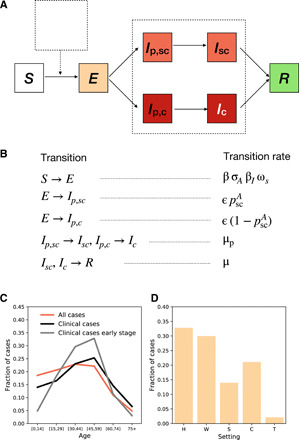
Fig. 2. Modeling COVID-19 epidemic.

(A and B) Compartmental model summarizing the epidemic states and transitions between states. Parameters and their values are reported in Table 1. (C) Cases by age for an uncontrolled epidemic. We show all cases (clinical and subclinical) in red and clinical cases in black. The gray line shows the clinical cases in the early stage of the epidemic (here defined as the first 30 days), with fewer cases among children than in later stages. (D) Transmission by setting (H, W, S, C, and T stand for household, workplace, school, community, and transport, respectively). The simulations were done with β = 0.25 corresponding to R0 = 3.1. Additional aspects of the outbreak are reported in the Supplementary Materials.
