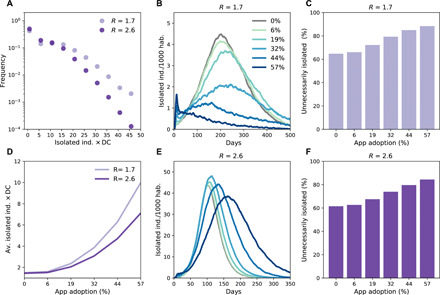
Fig. 5. Impact of combined digital contact tracing and household isolation on the isolation of individuals.

(A) Distribution of the number of isolated individuals per detected case (DC) for 57% of app adoption. (D) Average number of isolated individuals per detected case as a function of app adoption. (B and E) Percentage of the population isolated as a function of time for R = 1.7 (B) and R = 2.6 (E). ind., individuals. (C and F) Fraction of unnecessary isolated, i.e., fraction of contacts isolated without being positive.
