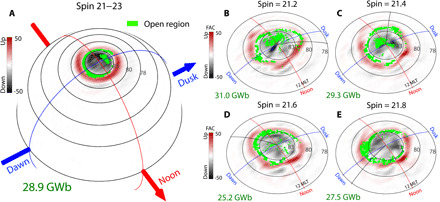
Fig. 3. Distributions of PC open flux and FAC density.

(A) Distributions averaged over simulation days 21 to 23. Instantaneous distributions at diurnal time 21.2 (B), 21.4 (C), 21.6 (D), and 21.8 (E). The open flux region is shown in green. Upward (downward) FACs are shown in red (gray). Projections are on the 6 RJ spherical surface versus MLAT and magnetic local time (MLT) with total open flux (in GWb) given at the lower left.
