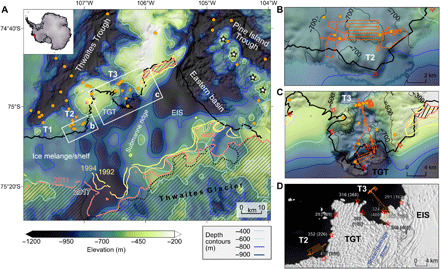
Fig. 1. Maps of the survey region showing the Thwaites Glacier Tongue and Eastern Ice Shelf.

Colors indicate bathymetry according to color bar, unsurveyed areas appear smoother as bathymetry from gravity inversion (7) is shown, and black solid line shows ice shelf and melange front in mid-February 2019. Orange dots indicate conductivity-temperature-depth (CTD) cast locations. (A) Bathymetry with notations indicating bathymetric features and areas discussed in the main text. Hatched regions show grounded ice, and colored lines show grounding line positions in the years indicated (1, 26) and the pinning point for Eastern Ice Shelf near the center of (A). White boxes outline areas shown in detail in (B) and (C), and orange lines in (B) to (D) show the autonomous underwater vehicle (AUV) mission paths. White stars indicate the irregular ridge separating Pine Island Bay from the eastern basin discussed in the text. (D) Ice-shelf front mapped with the multibeam echosounder overlaid on a grayscale Landsat 8 image of Thwaites ice front from 13 February 2019. The shear zone marking the boundary between Eastern Ice Shelf (EIS) and Thwaites Glacier Tongue (TGT) is indicated by blue text. Red stars mark the segments where average ice-shelf depths below sea level were calculated; numbers are the average ice-shelf face depths for that segment (see Methods), and numbers in parentheses are water column thickness (i.e., depth minus ice-shelf draft).
